Hunting Bullet Metrics
Apply Terminal Performance Truth
Hunting Bullet Metrics
2023 Zebra Management Hunt Report
Using 20% Synthetic Gel Test Results to Empirically Predict Penetration, Wounding, and Meat Damage from a 300 Winchester in Thin-Skinned African Plains Game Based on a 375 H&H’s Demonstrated Field Performance.
Scott Fletcher
March 2024
Scott Fletcher Hunting Bullet Metrics 2023 Zebra Management Hunt Report 1
1.0 Abstract
A 2023 zebra management hunt was conducted to evaluate if conceptual metrics identified in a personal analytical model, called “Guppy”, could be used with expanding hunting-bullet gel testing results to predict field terminal performance. The model and test results empirically predict a maximum travel distance after kill shots through common, thoracic-cavity vital organs using three different 30-caliber expanding hunting bullets of varying weight and generic designs. The maximum travel distance objective met by the 30-caliber bullets is based on the model, gel testing data, and demonstrated field performance of a .375-caliber, 300-grain hunting bullet used as the comparative standard. Wound cavity volumes determined in skinning-shed autopsies are graphically related to travel distance after the kill shot, kill-shot bullet impact energies, and kill-shot bullet impact velocities. Travel distances after the kill shots are graphically related to bullet impact energy. Evaluations are made of a kill-shot bullet’s ability to produce “shock”. Comparisons are made of model metric values to values obtained from skinning-shed autopsies. The effect of bullet weight loss preventing effective penetration through animals is evaluated as well as the potential for bullet weight loss producing observable, beneficial wounding. A model metric’s effectiveness in qualitatively predicting the volume of bloodshot meat is evaluated. Gel-test values of bullet weight retained, penetration, and expansion ratio are compared to field values of retained bullets. An alternative definition of shock is proposed based on carcass tissue damage observed during skinning. Implications of the field data on historically accepted terminal performance metrics are presented. A modification to the testing methodology is presented based on data obtained from the hunt. The field performance of the 30-caliber bullets is evaluated based on hunt application, penetration, wounding, and meat damage.
2.0 Report Warnings and Disclaimers
The words “300 Winchester” and “375 H&H”, as used in this report, are chamberings, not calibers. Both of these chamberings are custom and do not conform to SAAMI specifications. Both have extended throats to accommodate long, heavy bullets. Hand -loaded ammunition was used for both the 30-caliber (.308-inch diameter) bullets used for the management hunt referenced in this report and the .375-caliber (.375-inch diameter) bullet referenced in this report as the comparative standard. Overall cartridge lengths (COAL) used for this ammunition do not conform to lengths typically found in reloading manuals. Barrel lengths used both for testing and for hunting are not typical of barrel lengths commonly referenced in reloading manuals. Consequently, using hand loads to reproduce specific impact velocities referenced in this report could produce unsafe pressure in other firearms.
The 375 H&H is considered as lower-bound satisfactory by many reputable Africa PH’s for taking African dangerous game. Furthermore, a 300-grain bullet is considered by many reputable Africa PH’s as a satisfactory-weight bullet for taking dangerous game. Although this chambering and a 300-grain bullet can generally be considered satisfactory for taking dangerous game, no African dangerous game has been or ever will be taken by me with the .375-caliber, 300-grain bullet referenced in this
Scott Fletcher Hunting Bullet Metrics 2023 Zebra Management Hunt Report 2
report. Reasons with embedded terminal performance criteria are well beyond the scope and intent of this report, and will not be presented nor discussed.
The 300-grain, expanding hunting bullet referenced in this report has subjectively demonstrated desirable field performance on animals considered as thin-skinned, African plains game. Consequently, it is the standard by which the referenced 30-caliber bullets have been judged for hunting only thin-skinned African plains game. In my opinion, the 300 Winchester is NOT a satisfactory chambering for hunting African dangerous game, nor is any 30-caliber bullet.
The manufacturer and specific bullet references identified in this report are an issue of convenience in presenting and discussing the gel-test and hunting results, the reasons associated with each bullet’s selection for evaluation on this management hunt, and the field terminal performance results. Reference to a manufacturer’s specific bullet and inclusion in this report should not be interpreted as an endorsement nor an inference of “best” or “suitable” for any hunting application.
The testing performed produced impact velocities from my personal firearms and unique handloads at a test distance considered applicable for a specific, defined hunting problem. The specific 30-caliber bullets used on the referenced management hunt were selected based on weight considered appropriate for the animals to be hunted, a bullet’s generic design deemed compatible with the test impact velocities, metrics both obtained from testing in 20% synthetic gel and defined by a specified, personal analytical model, and specific terminal performance objectives based on the defined hunting problem. The terminal performance results presented and discussed in this report reflect those constraints. Any deviations within those constraints should be expected to produce outcomes different from those presented in this report.
All data contained in my eBook and this report were obtained by me at my time and expense. No person, manufacturer, or vendor furnished complimentary products, services, equipment, hunting opportunities, or advice to obtain these data. Furthermore, I have not been retained nor compensated by any entity to consult nor furnish data associated with either my eBook or this report. In summary, there is no vested interest in any potential outcome associated with either my eBook or this report.
3.0 Introduction
In 2022 I self-published an online eBook entitled Africa Hunter Quest. A primary book objective was to describe a personal modeling and testing analytical evaluation process developed for rationally selecting a bullet with a caliber (diameter) smaller than .375 that could potentially replicate the demonstrated field terminal performance of a 300-grain cup-and-core bullet, shot from a personal 375 H&H. The process relied on a personal empiricism to estimate game weight that could reasonably be taken with an expanding hunting bullet of known weight and impact velocity (eBook Chapter 4 and Chapter 19), and a personal theoretical, expanding hunting bullet terminal performance model. This terminal performance model relies on data obtained from testing expanding hunting bullets in 20% synthetic gel. Both the model, called Guppy, and the bullet testing
Scott Fletcher Hunting Bullet Metrics 2023 Zebra Management Hunt Report 3
in gel are based on research done in the 1970’s by Dr. Martin Fackler, a military physician with the rank of colonel.
The Guppy model was created to provide metric test values, as defined in Guppy Tech, to conceptually evaluate the simulated wound cavity formed by an expanding hunting bullet in any gel under idealized conditions. Such idealized conditions include no breaching of bone with any attendant post-breaching bullet tumbling. The debilitated muscle tissue and vital organs, called “bloodshot meat” by hunters, are included in the model.
As described in eBook Chapter 13, Chapter 14, Chapter 15, Chapter 16, and Chapter 17, these metrics allow reasonable conceptual explanations of the wound cavity shape differences that occur in the gel caused by bullets with different generic designs and impact velocities. These shape differences are the result of bullet deformations controlled by each bullet’s generic design and impact velocity, and can be used to qualitatively assess a bullet’s likely field terminal performance characteristics. Furthermore, the conceptual explanations of this deformation afforded by these metrics allow accurate postulations of bullet performance based on modifications of generic design details and changes in impact velocity, as described in eBook Chapter 14.
The primary objective of this management hunt is to identify if the Guppy metrics and metric values obtained from testing in 20% synthetic gel could also empirically predict actual field performance outcomes. This empirical process is a simple same-and-different comparison of applicable test metric values between candidate bullets and a tested bullet designated as a standard. The objective of this test-metric comparison is to predict the field performance of the candidates based on the demonstrated terminal performance of the standard. This process fundamentally assumes a common degree of typical hunt variables that essentially cancel out, leaving the simplistic test metric values as the basis of comparison.
The model and subsequent analyses relegate the terminal performance relevance of hydrodynamic (hydrostatic) shock to a secondary consideration (eBook Chapter 6). The bullet’s retained mushroom diameter is assessed to be relevant primarily in assessing a bullet’s “sweet-spot” impact velocity range, as determined from wound cavity volumes either calculated or measured from gel testing at various impact velocities (eBook Chapter 10 & eBook Chapter 11).
The gel testing demonstrates that bullet weight loss produced bullet shards, called shrapnel, that were randomly flung radially away from the bullet’s trajectory through the gel. The shrapnel produced from this bullet weight loss is assessed to be a significant contributor to wounding by producing tributary drainage pathways to the bullet hole that enhance rapid bleed-out (eBook Chapter 13). Bullet penetration is considered to be a metric essentially independent of weight loss, dependent primarily on a bullet’s generic design and impact velocity (eBook Chapter 11 & eBook Chapter 13). Finally, energy is considered to be irrelevant in assessing terminal performance (eBook Chapter 6), as is bullet jacket-core separation (eBook Chapter 11).
Scott Fletcher Hunting Bullet Metrics 2023 Zebra Management Hunt Report 4
Such thinking and applied analyses are contrary to what are interpreted as accepted terminal performance doctrines. A bullet-testing medium other than FBI ordinance gel is considered to produce unrealistic/inapplicable data. There is an implied, direct correlation of a bullet’s impact energy to both the degree of wounding and the drop-to-the-shot reaction of “hydrostatic” shock. More energy is universally accepted as better in producing these terminal performance outcomes.
When a bullet is tested, a subjective appraisal of “too much” bullet weight loss, including a jacket-core separation, is typically interpreted as direct evidence of likely marginal-to-unacceptable field performance. Bullets recovered from animals that exhibit “too much weight loss” are also regarded as marginal to unacceptable regardless of bones breached, the actual penetration of the recovered bullet, and the degree of wounding visible in the animal. Furthermore, off-axis, unsymmetric, and small- diameter mushrooms of bullets retained from testing or from animals also imply marginal-to-unacceptable terminal performance. Finally, there is typically no recognition that the only way any supposed marginal, field bullet data could be obtained was from recovered animal.
The legitimacy of any analytical method used to explain or predict terminal performance logically requires confirmation with applicable data from an actual hunt, obtained in sufficient number to establish some measure of statistical confidence beyond “one and done”. Even if the same species is repeatedly hunted in the same environmental conditions, multiple variables can be introduced that potentially affect the interpretation of the terminal performance results. Inconsistent shot distances can result in significantly variable impact velocities. Inconsistent aim because of marksmanship error or shot angle (broadside, front-quartering, etc.) can result in variable penetration lengths through the intended vital organs or a complete miss of the intended vital organs. Bullet variables can include both tumbling and deviation from aim alignment because of breaching bone. Animal variables could include its physiological condition (blood pressure, pulse, adrenalin level) prior to the shot. Thus, any interpretation of terminal performance should at least acknowledge such field variables and account for them in a meaningful way.
4.0 Report Contents
This report presents conclusions with attendant, supporting data concerning the relevance of the Guppy model and gel testing methods for predicting terminal performance outcomes that occurred during a July 2023 zebra management hunt. These conclusions are based on the results obtained from testing hunting bullets in 20% synthetic gel, analyses that used the test data in the Guppy model, data obtained in skinning-shed autopsies, and field observations made by both me and a certified Professional Hunter (PH) with 24 years of experience. Included in this report are summary narratives of relevant background information, the defined hunting problem that identified the potential 30-caliber hunting bullet candidates with the attendant chambering, the terminal performance standards that the 30-caliber bullets had to meet,
Scott Fletcher Hunting Bullet Metrics 2023 Zebra Management Hunt Report 5
the bullet screening criteria (including gel testing results) used to select the bullets used on the hunt, and procedures/methods associated with the field data obtained.
Data from the hunt are presented/summarized in the report text, supplemented with nine Tables, seven Graphs, and seventy-two Photos appended to this report. Detailed discussions of these data are presented, with multiple comparisons of gel-test data to data obtained from skinning-shed autopsies. Detailed discussions of the terminal performance implications of these data are presented, including focused conclusions considered applicable. Definitive, summary conclusions are presented for the ten hunt objectives identified in the following report section. Refer to the Table of Contents for specific topics discussed.
5.0 Hunt Objectives
There were ten objectives associated with the management hunt.
The first objective was to assess if the Guppy model metrics obtained from testing expanding hunting bullets in 20% synthetic gel reasonably predicted field terminal performance and skinning-shed observations of thin-skinned African plains game.
The second objective was to determine if there was an identifiable and logical relationship between wound cavity volumes determined from skinning-shed autopsies and travel distance after the kill shot.
The third objective was to determine if there was an identifiable and logical relationship between bullet impact velocity and wound cavity volumes determined from skinning-shed autopsies.
The fourth objective was to assess if there was any apparent and reasonable relationship between a bullet’s impact energy and travel distance after the kill shot, wound cavity volumes determined in the skinning shed, and what hunters typically call hydrostatic shock.
The fifth objective was to assess if a bullet’s field weight loss adversely affected its effective penetration through vital organs.
The sixth objective was to assess if bullet penetration lengths, weight retentions, and expansion ratios determined from testing in 20% synthetic gel were representative of actual field values.
The seventh objective was to assess if the shrapnel produced by a bullet’s weight loss resulted in observable/beneficial wounding and tissue bleeding.
The eighth objective was to assess if the Guppy model needed any modifications to better empirically predict field terminal performance based on field observations and data.
The ninth objective was to determine if the Guppy model, combined with testing in 20% synthetic gel, could be used to empirically evaluate any terminal performance objective based on a defined hunting problem using specific bullets from any specified chambering.
Scott Fletcher Hunting Bullet Metrics 2023 Zebra Management Hunt Report 6
The tenth objective was to assess the over-all terminal performance of the selected 30-caliber bullets on thin-skinned African plains game.
6.0 Background Information
Eleven, thin-skinned African plains game animals ranging in size from a bush buck to a zebra have been personally taken with the 300-grain, cup-and-core bullet referenced in this report. All animals have been shot through their thoracic cavity, with wounding assessed to have occurred in both lungs and the heart. Six animals have dropped to the shot without being spined, and five have traveled no more than about 90 yards based on pace. Such performance is considered as essentially stopping an animal, and is in keeping with a personal terminal performance objective. For thin-skinned African plains game trophy hunting, this 300-grain bullet is considered the personal standard to which all other bullets with their attendant chamberings are to be compared.
However, three Africa PH’s had indicated that a 375 H&H was essentially “too much gun” for use on management hunts where reducing ammunition cost and concurrently obtaining a maximum volume of edible meat were priorities. Corroborating testimony had come from a salty Afrikaner hunter who had observed my drop-to-the-shot nyala being skinned and had curtly decreed “way too much meat damage”. The nyala had been taken with my 300-grainer. Therefore, a smaller-caliber, less-expensive bullet/ammunition with attendant chambering had to produce both a personal, subjective terminal performance of “stop” while concurrently producing a volume of bloodshot meat judged by an experienced PH to be satisfactory for use on a management hunt.
The search for such a bullet with attendant chambering that could be considered satisfactory as both a trophy and management bullet included testing eleven bullets of various calibers, weights and generic design in 20% synthetic gel rather than FBI ordinance gel. Reasons are discussed in eBook Chapter 12. In addition to the .375-caliber, 300 grainer that served as the standard for comparison, gel tests were performed on five, 35-caliber and five 30-calber bullets. Four of five interpreted generic, expanding hunting bullet designs were tested (generic designs described in eBook Chapter 13, Chapter 14, Chapter 15, Chapter 16, & Chapter 17).
Gel-test results for the metrics schematically depicted in Guppy and defined in Guppy Tech were determined for each bullet, then compared to the test values obtained from the 300-grain “standard”. The testing evolved into a contest among all the bullets because the selected test distance replicated the average shot distance identified from five previous hunts in the Limpopo province of South Africa. The testing methodology, the chamberings used, the rationale for the contest ranking, and the method of scoring the gel-test results are described in eBook Chapter 12. The results and subsequent bullet rankings are presented in eBook Chapter 13, Chapter 14, Chapter 15, & Chapter 16.
Prior to the 2023 management hunt, field terminal performance objectives were discussed with the outfitter/PH, Mr. Koos DeMyer of Kuche Safaris. Mr. DeMyer recommended that the management animal be Burchell’s zebra. A Burchell’s zebra had
Scott Fletcher Hunting Bullet Metrics 2023 Zebra Management Hunt Report 7
been personally taken in the Limpopo province using the 300 grainer. The shot distance had been about 120 yards, and the zebra had only traveled an estimated (paced) 35 yards afterwards. No skinning shed autopsy had been performed. However, the bullet’s impact location on the animal and the prolific blood weeping from the bullet entrance hole indicated wounding had occurred in both lungs and the heart.
The travel distance of 35 yards associated with this one zebra was assessed to be unrepresentative. Consequently, the 300 grainer’s demonstrated overall maximum field travel distance of 90 yards was preliminarily selected as a more realistic, quantifiable upper-bound, maximum travel distance performance standard.
7.0 The Defined Hunting Problem Used to Select Bullets with Attendant Chambering
eBook Chapter 9 presents key elements of a hunt considered essential to select both a responsive bullet/chambering and a hunting strategy/plan. The following is a general discussion of the 2023 management hunt problem definition, followed by a filled-in outline form, as chronicled in eBook Chapter 9.
Published information indicates a Burchell’s zebra can be expected to weigh on the order of 600 (mares) to 700 (stallions) pounds. In addition to a management hunt, I wanted to take a black wildebeest as a trophy animal. Bulls are expected to weigh on the order of 360 to 400 pounds.
The management hunt was to be in the Free State province of South Africa, near Bloemfontein. Two prior hunting trips had included hunts in the Free State. Terrain can vary from gently to steeply rising, cobble-to-boulder-strewn hills with sparce to dense brush, interspersed with broad, relatively flat prairie-like grass land. Wind was expected to be a factor, with estimated velocities ranging from at least 10 to over 20 mph. Photo P-1 and Photo P-2 show representative terrain and vegetation from the actual hunt areas.
In Kevin Robertson’s second edition of The Perfect Shot (Safari Press), he indicates potential shots on black wildebeest could range from about 250 t0 350 yards. Such a shot distance suggested a hard scope zero of at least 250 yards, with come-ups for both 300 and 350 yards. I concluded that shots on zebra could also potentially range out to 350 yards, with a 250-yard zero also being applicable.
Robertson describes the black wildebeest as “an exceptionally tough species…..and potentially dangerous when wounded”. When discussing zebra, Robertson indicated “in the realm of being tough, the zebra ranks up there with the best of them”. Indeed, every PH asked to assess the toughness of African plains game had assigned the zebra a rank in the top three. The other animal in the top three was invariably the blue wildebeest, the black wildebeest’s cousin. Both a black wildebeest and any-gender zebra would likely provide stringent, upper-bound terminal performance challenges to any bullet with attendant chambering selected, particularly given the expected shot distances.
Scott Fletcher Hunting Bullet Metrics 2023 Zebra Management Hunt Report 8
The demonstrated travel-distance performance of the 300 grainer had been obtained based upon taking out the heart (or plumbing directly above the heart) and both lungs of all the eleven animals on which it had been used. The aim point of all animals had been the heart, as identified by Robinson in his book. Consequently, the desired aim point on all animals for this management hunt was the heart, with a diameter judged to be approximately five inches. The preferred shot angle to access the heart was broadside to enable assessment of bloodshot meat obtained, preferably from both shoulders. The second-most desirable shot angle was front quartering, as such a shot would only provide assessment of bloodshot meat from at least one shoulder. Least desirable shot angles were both the full frontal and rear quartering. These shot angles would likely not produce bloodshot meat on the shoulder to any appreciable degree.
The preferred hunting method is walk-and-stalk or spot-and-stalk. Those hunting methods, coupled with the expected terrain and vegetation, indicated a potential shot out to 350 yards could be considered as “more-likely-than-not” for both species. Based on the expected grass height, shots out to 350 yards dictated that the seated bipod position be used to reasonably take out the heart. That position had successfully been used in the Free State on a previous hunt to take out the heart of multiple springboks at up to 364 yards.
There was no realistic way that any of the tested 35-caliber bullets fired from a personal 358 Winchester would produce terminal performance associated with “stop” at a maximum shot distance of 350 yards. That assessment essentially dictated that a personal 300 Winchester be used, as there was no available alternative in terms of rifle and hand-loaded ammunition. The 30-caliber bullets selected, the rationale for their selection, their likely impact velocities, and the expectations for their terminal performance will be subsequently discussed.
The following provides hunting problem definition information in the same format presented in eBook Chapter 9.
- Hunting method: walk-and-stalk or spot-and-stalk.
- Shot distance: estimated to be 150 to 350 yards.
- Impact velocity: as subsequently discussed.
- Scope zero: 250 yards, with come-ups for 300 and 350 yards.
- Vegetation: moderately to widely spaced brush, waist to over-the-head high; grass, ankle-to-knee high.
- Terrain: shallow to moderately sloping, cobble-to-boulder-strewn hills to broad, relatively flat prairie.
- System accuracy: three shots less than ¾ inch, on centers, at 200 yards.
- Shooting position: sticks out to 200 yards; seated with bipod from 200 to 350 yards.
- Aim point target size: heart at 5 inches in diameter; lungs at 10 inches in diameter, preferably accessed by a broadside shot.
- Hunter skills: only satisfactory with diligent practice off of sticks and from a bipod. Field craft mediocre at best, due primarily to arthritic knees.
Scott Fletcher Hunting Bullet Metrics 2023 Zebra Management Hunt Report 9
- Wind: will be a factor based on expected velocity of 10-20 mph and likely shot distances.
- Animals and animal risks: Black wildebeest, 360 to 400 pounds – risks could be significant if wounded. Zebra, 600-700 pounds, no appreciable risk.
- Financial risks: Black wildebeest @ $1200. Zebra @ $800.
8.0 Screening of 30-Caliber Candidate Bullets for Field Terminal Performance Evaluation
8.1 Bullet Nomenclature and Abbreviations
Table 1 identifies gel-tested, 30-caliber candidate bullets referenced in this report as well as the 300-grain, .375-caliber standard in terms of their generic design and specific manufacturer nomenclature. Photo P-3 shows the tested bullets. From left to right: 300 SGK; 200 WWC; 240 TSMK; 180 SAF; 220 SPH; and 165 BTSX.
8.2 Gel Test Results and Their Primary Basis for Application
Table 2 presents the gel-test results for all 30-caliber bullet candidates as well as the .375-caliber, 300-grain standard in terms of the metrics identified in Guppy and defined in Guppy Tech. These test results are referenced with each bullet’s abbreviation noted in Table 1. Other than for the metric I(V) (as subsequently discussed), gel-test values of the .375-caliber, 300 SGK are the metric-standard values used to judge all 30-caliber candidate bullets.
Gel-testing methodology is described in eBook Chapter 12. All bullets were shot from personal rifles except for the 165 BTSX, which was shot from a friend’s 308 Winchester. All cartridges were personal hand loads except for the 180 SAF, purchased as “off-the-shelf” ammunition.
Table 2 also includes each bullet’s weight retained (WR) and its expansion ratio (ER) obtained from the test bullets retained in the gel. The expansion ratio is a way to compare each bullet’s ability to expand. The expansion ratio, multiplied by the caliber (diameter), is equal to the average mushroom diameter of the bullet.
Changes in test impact velocity will produce changes in the gel-test metric values. Empirical predictions of field performance based on these values depend on field impact velocities being reasonably comparable to test impact velocities. Shots that produce field impact velocities no greater than plus or minus 100 fps of the test impact velocity are judged to be representative and applicable for both predicting and interpreting field performance. Shot distances that produce impact velocities outside of this velocity bracket may not result in the expected field terminal performance, or may make interpretations of the actual field results problematic.
Scott Fletcher Hunting Bullet Metrics 2023 Zebra Management Hunt Report 10
8.3 Desired Bullet Terminal Performance
8.3.1 Specified Terminal Performance Criteria
Any selected 30-caliber bullet needed to reasonably replicate the observed maximum travel distance performance of the 300 SGK, but without unacceptable meat damage. Achieving that outcome indicated four performance criteria needed to be met:
1) The bullet must demonstrate achieving a satisfactory estimated plains-game weight (EPGW) of the hunted animals, as calculated with the personal empiricism identified in eBook Chapter 4, in accordance with a reasonable/responsive hunting strategy suggested by the hunting problem definition.
2) Exemplary 30-caliber bullet field performance must be an animal dropping to the shot or a travel distance less than 100 yards from a kill-shot bullet through a thoracic cavity, completely breaching the heart (or the plumbing directly above the heart) and both lungs. This performance is based on the 300 SGK’s demonstrated field performance of a maximum travel distance of 90 yards after completely breaching the referenced organs. This travel distance performance had all been obtained in the Limpopo province where the average shot distance was 135 yards. The stipulated maximum travel distance of 100 yards is slightly higher than the 300 grainer’s demonstrated field maximum of 90 yards. This travel distance increase is because the average shot distances in the Free State will likely be greater than the test distance of 135 yards. This greater shot distance will likely result in a reduction of the 30-caliber bullet candidates’ predicted field wounding capability, as subsequently discussed.
3) The penetration for all bullets must result in completely breaching the thoracic cavity from all shot angles. As discussed in eBook Chapter 11, such penetration takes out vital organs and is considered “effective”. For all shot angles, effective penetration means the bullet should be at least retained by the far-side hide, completely breaching the thoracic cavity and at least one shoulder. Breaching only one shoulder on a broad-side shot allows for bullet deflection from near-side bones. A bullet completely exiting the animal from any shot angle is not required.
4) Bullets passing through shoulder tissue must produce a volume of bloodshot meat (BSM) qualitatively judged by an experienced PH to be acceptable.
If all four performance criteria could be met, the bullet, with attendant chambering, would be considered as a reasonable substitute to the 375 H&H/300 SGK for use on thin-skinned, applicable-weight animals for both trophy and management hunts. If only the first three criteria could be met, the bullet, with attendant chambering, would be considered satisfactory for use on trophy hunts.
The results obtained from the analysis embedded in Criterion 1) were the fundamental basis for initially selecting most of the bullets that were gel tested. Limiting the time to death was and is more important than limiting meat damage, emphasized quantitatively by Criterion 2).
Criterion 2) indicates that “exemplary” field performance essentially replicates the field performance of the 300 SGK. The word “exemplary” acknowledges that a 30-caliber bullet, with an end area approximate 33% less than a .375-caliber bullet and potentially
Scott Fletcher Hunting Bullet Metrics 2023 Zebra Management Hunt Report 11
weighing up to 33 % less, is being asked to exhibit essentially the “same” demonstrated field performance as a .375-caliber bullet.
Criterion 3) is in keeping with what John Taylor stated in his book entitled African Rifles and Cartridges (Safari Press). Based on taking literally thousands of animals other than elephant, he was convinced that they expired quicker when the bullet was retained by the far-side hide rather than with a complete pass-through.
Criterion 4) is extremely subjective. Conversations with multiple Afrikaner hunters and PH’s indicated that even “some” BSM can be considered too much. As will subsequently be discussed, the 300 SGK’s gel-test data could indicate that the one hunter who passed judgement on a nyala’s meat damage produced by this bullet may have been a “no-meat-damage” absolutist. Regardless, an impartial, objective appraisal of BSM by an experienced PH who “understood the business” and had seen hundreds of skinning shed results from multiple generic bullets would be required.
8.3.2 Criterion 1) Screening for All Candidate Bullets: EPGW Compliance
All candidate bullets were first evaluated for compliance with Criterion 1) using the personal empiricism presented and discussed in eBook Chapter 4 and Chapter 19, respectively. The intent was to assess if a candidate bullet had sufficient weight to reasonably take the intended game based on impact velocities at the shot distances identified in the hunting problem definition.
Table 3 presents those results for both the 300 SGK and all the 30-caliber candidates. These estimated game weights are based on chronographed muzzle velocities for all but the 165 BTSX, published BC’s, and an estimated BC for the 240 TSMK. The muzzle velocity assumed for the 165 BTSX was estimated based on my 300 Winchester’s 22-inch barrel length and published reloading manual data. Shots on 600- to 700-pound zebras were considered primarily important to assess each 30-caliber bullet candidate’s compliance with Criterion 1).
Table 3 indicates only three, 30-caliber bullets complied with Criterion 1): the 220 WWC, the 240 TSMK, and the 220 SPH. These three bullets were further evaluated to assess if any could reasonably meet Criterion 2).
Terminal Performance Time Out #1
Readers that have persevered to this point in the report could be uncomfortable. Furthermore, some are likely sideways at the presumption that “tried-and-true” bullets from both Swift and Barnes are summarily being excluded.
Reading the referenced eBook chapters and studying Guppy and Guppy Tech are really the only ways to potentially “get comfortable” with the testing and analytical methodology with the associated numbers. There is no realistic way to provide the context and detail in summary form. Accepting the model, the embedded metrics, the testing methodology, and the relevance of the test results is simply a leap of faith, the same one personally made without benefit of the outcome knowledge subsequently presented in this report.
Scott Fletcher Hunting Bullet Metrics 2023 Zebra Management Hunt Report 12
Another issue that contributes to “comfort” is the ability to see/visualize what is being discussed. Photo P-4 shows a side view of the test setup. The chronograph’s sky screens have been positioned in front of the wooden cradle that supports the gel blocks. Photo P-5 shows the end view of the test setup, with the gel blocks positioned in the center of the cradle. The red dot that is visible is the aim point on the first gel block. The red dot has been taped to an impala hide that has been secured to the front face of the first gel block. Impala hide with an average thickness of 0.050 inches was secured to the front gel block for all bullet tests. Photo P-6 shows the cavities formed in the gel blocks after passage of the 300 SGK (top) and the 165 BTSX (bottom). The bullets traversed through the blocks from left to right. Photo P-7 shows both the initial, pretest bullets and their mushroomed shapes caused by passage through the gel for both the 300 SGK (left) and 165 BTSX (right).
The 300 SGK’s gel cavity represents what the 30-caliber candidate bullets were competing against. The 165 BTSX’s gel cavity represents a 30-caliber bullet contender that finished next to last in the bullet competition described in eBook Chapter 12. The generic shape of the cavity formed in the gel block by the 300 SGK is a “guppy”, and the generic shape formed by the 165 BTSX is an “eel-snake”, referenced in eBook Chapter 7.
Photo P-8 shows wafers sliced from the gel blocks to enable measurement of their fracture diameters. Photo P-9 shows a gel wafer being magnified and lighted to better identify the fracture limits prior to measurement with a dial caliper.
Refer Guppy and Guppy Tech for the nomenclature/definitions used for quantitatively evaluating these cavities. Refer to eBook Chapter 12 for a discussion of specific test procedures.
Criterion 1) relies a simplistic “formula” that ignores both the merits and the limitations of each bullet’s generic design. Furthermore, it ignores performance data that some hunters “know” to be true. Such blatant omissions have likely elicited skepticism ranging up to and including “male bovine excrement”. The rationale and justification for using the empiricism and omission of potential “over-achiever” bullets are discussed in eBook Chapter 19.
Use of the empiricism in Criterion 1) has only indicated that both the 180 SAF and 165 BTSX are simply too light based on the defined hunting problem. Heavier bullets from either manufacturer could be substituted and evaluated in terms of EPGW and impact velocity associated with each bullet’s generic design to satisfy Criterion 1).
Using a sports analogy, selecting a football player that only weighs 260 pounds to play offensive guard for a professional football team is a risky choice, no matter how strong, quick, or experienced at the collegiate level he may have been. Satisfying Criterion 1) only gets the candidates for the intended position on the team. The team member that will be identified as the first-string player at that position will be determined by subsequently discussed criteria.
Scott Fletcher Hunting Bullet Metrics 2023 Zebra Management Hunt Report 12
8.3.3 Criterion 2) Screening for the 200 WWC, 240 TSMK, & 220 SPH: Maximum Travel Distance Assessments
General Discussion
Achieving Criterion 2) is dependent on the validity of Dr. Fackler’s conclusion that time to death is directly related to the magnitude of the wound cavity volume, with a greater volume equating to a shorter time to death. My presumption is that wounding is also related to travel distance, with greater wounding resulting in a shorter travel distance after the shot.
This presumption is valid only if the animal’s response to the shot is to flee, “sprinting” at a reasonably common speed. Such a response is typical and expected for the size and demonstrated tenacity of the animals to be hunted. In doing so, travel distance is, mathematically, directly related to time to death. If both Dr. Fackler’s wounding conclusion and my presumption of travel distance being related to time to death are true, then selecting candidate bullets with an identified wounding metric value comparable to the 300 SGK’s should result in a field travel distance that is also comparable.
Test Metric Used to Evaluate Criterion 2)
Table 2 indicates that only two wound volume determinations were made from gel testing: V(ST) and V(T). V(ST) is the modeled volume of both the bullet hole and the surrounding bloodshot tissue; V(T) is the total volume of the modeled wound cavity throughout the bullet’s test length, and includes V(ST).
As indicated in Table 2, a significant percentage of the total wound cavity volume is represented by V(ST). V(ST) values range from about 85% (165 BTSX) to 97% (240 TSMK) of V(T), with typical values around 95%. Subjectively, the true “violence” produced by any bullet can reasonably be associated with where the primary location of bloodshot tissue occurs. As shown in the Guppy schematic, the primary location of modeled BST is within the volume identified as V(ST). Assuming that 20% synthetic gel is representative to conservative in simulating penetration through both bone and all animal tissue, the majority of V(ST) is assumed to occur in the thoracic cavity on a broadside shot. Consequently, V(ST) was selected as the primary metric for evaluating Criterion 2).
Effects of Bullet Weight Loss in Evaluating V(ST)
Review of Table 2 indicates both the 240 TSMK and the 220 SPH lost about 40 % of their weight from passage through the gel. This weight loss is the result of stripping the lead core and copper jacket from the bullet as it attempts to maintain its mushroom shape. This continuous reforming of the mushroom and the resultant loss of weight could potentially have contributed to a reduced total penetration length, L(T).
The weight loss of both the 240 TSMK and the 220 SPH results in both copper-jacket and lead-core shards that can be characterized by the word “shrapnel”, as discussed in eBook Chapter 11. Passage of shrapnel shards through tissue both destroys it and creates additional tributary conduits to the actual bullet hole that accelerate bleed-out. Thus, shrapnel formed due to bullet weight loss through tissue can produce enhanced
Scott Fletcher Hunting Bullet Metrics 2023 Zebra Management Hunt Report 14
wounding, potentially contributing to the terminal performance objective of a quicker time to death.
Photo P-10 shows the first gel block from the 240 TSMK’s test. Note the one lead shard visible at a penetration length of about 8-3/4 inches, and the two lead shards visible at about 10 inches. The lead shard at 8-3/4 inches and the lower-most one at 10 inches are within the fracture limits of the modeled cavity. The upper lead shard at 10 inches extends beyond the cavity’s fracture limits. There is a fracture visible in the gel behind this upper lead shard that can be traced back to about 8-1/2 inches. The lower lead shard at 10 inches also has a fracture visible in the gel behind it that can be traced back to about 8-1/2 inches. Both of these shards are interpreted to have peeled away from the bullet’s mushroom at a penetration length of about 8-1/2 inches, then were propelled forward by the momentum forces of each. Their momentum carried them to the previously referenced penetration lengths.
Copper shards are also visible in Photo P-10. There is one visible within the cavity-fracture boundaries at a penetration length of about 11 inches, and one is visible outside of the cavity-fracture boundaries at about 13-1/4 inches. Although it is not clearly shown in this photo, examination of this block in the shop indicated the “launch point” penetration length of the shard at 11 inches was about 10-1/2 inches, and the “launch point” penetration length for the shard at 13-1/4 inches was at about 12 inches.
Photo P-11 shows the shard identified in Photo P-10 at a penetration length of about 13-1/4 inches. The green-tipped bullet points to the shard, and the other bullet points to the actual fractures made by the passage of the bullet. The shard identified by the green-tipped bullet is obviously beyond the cavity fracture limits.
Photo P-12 shows the 240 TSMK that was recovered from the gel as well as all the easily identifiable lead and copper shards from the first gel block. The circular piece shown at the bottom of the picture is a 30-caliber bullet shank, provided for scale.
Photo P-13 shows the first gel block from the 220 SPH’s test. (The labeling of the bullet in this photo and subsequent Photo P-14, Photo P-15, Photo P-16, and Photo P-17 is incorrect.) Photo P-14 is a close-up of Photo P-13, showing the interval from about 4-1/2 to 13-1/2 inches of penetration. As with Photo P-10, multiple lead and copper shards are visible in both Photo P-13 and Photo P-14. Some of these shards are also well beyond the cavity’s fracture limits, such as the shards at about 7 inches, 10 1/2 inches, and 12-1/2 inches shown in Photo-14. (Photo P-13 presents a clearer representation of the shard at about 7 inches)
Photo P-15 shows the shards at about 10-1/2 inches, interpreted to be both within the cavity fracture boundaries (green-tipped bullet on the left) and outside the fracture boundaries (green-tipped bullet on the right). The “launch point” of these shards is interpreted to be at a penetration length at about 8-1/2 inches. Photo P-16 shows the recovered shards identified in Photo P-15. Photo P-17 shows the 220 SPH that was recovered from the gel as well as all the easily identifiable lead and copper shards from the first gel block.
Photo P-13 also identifies the random way a cavity can be formed from jacket and core spalling from irregular/random mushroom formation of a cup-and-core bullet. Note that
Scott Fletcher Hunting Bullet Metrics 2023 Zebra Management Hunt Report 15
from about 5-1/2 t0 6-1/2 inches of penetration, the cavity apparently begins to decrease in diameter, but then apparently begins to increase in diameter thereafter. Measured diameters substantiate the apparent decreasing, then increasing cavity diameters with penetration length. The following tabulation shows this trend:
Penetration Length, in Average Cavity Diameter, in
4 1.925 (max)
4-1/2 1.890
5 1.891
5-1/2 1.298
6 1.188
6-1/2 1.467
7 1.781
7-1/2 1.796
The bullet is interpreted to have begun shedding its initial mushroom at about 5 inches because the bullet’s lead and copper weren’t strong enough to withstand the drag shear force imposed by the gel on its unreinforced shape. This mushroom shedding/spalling occurred until about 6 inches of penetration, after which the drag force began to deform rather than shear the lead and copper, thus re-forming the mushroom.
As discussed in eBook Chapter 12, the calculated cavity volumes do not include any additional volume associated with the radial extent of these shards beyond the cavity’s fracture limits. The primary reason was the production and particle-size distribution of the shards would likely not be consistent on a test-by-test basis. The objective of selectively omitting the radial extent of these shards was to obtain V(ST) test values that were conservative representations of expected cavity volumes.
The prospect of random shard production is exemplified by both Photo P-12 and Photo P-17. Both Photos indicate that the maximum shard size and distribution of shard sizes are random and “luck-of-the-draw”. Such likely inconsistency underscores the reason why both the occurrence of the shards and the extent of shard travel distance beyond the fracture limits in the gel blocks were omitted in calculating V(ST).
As an engineer trying to use test data to predict real-world results, such an omission is considered “conservative” and reflects prudence. Consequently, the resultant computed V(ST)s for both the 240 TSMK and the 220 SPH are considered a conservative underprediction of what would result in a field application.
Using the 300 SGK’s V(ST) value of 26.4 cubic inches as the “standard”, the bullet with the next-highest V(ST) value is the 200 WWC with 23.5 cubic inches, followed by the 240 TSMK at 20.5 cubic inches, then the 220 SPH at 19.3 cubic inches. The V(ST) value of the 200 WWC was judged as reasonably comparable to the 300 SGK because the weight loss from both bullets was insufficient to affect the calculated volumes. As previously discussed, the V(ST) values of both the 240 TSMK and 220 SPH are conservatively
Scott Fletcher Hunting Bullet Metrics 2023 Zebra Management Hunt Report 16
underpredicted, and demonstrated field wounding could potentially indicate parity with both the 300 SGK and the 200 WWC.
Terminal Performance Time Out #2
Criterion 2) relies solely on gel-test results that many would consider unrealistic/inappropriate for multiple reasons. First, the modeled testing does not take into account effects of the bullet breaching any bone prior to entering the thoracic cavity. Such a breach would introduce indeterminant and variable field terminal performance factors unaccounted for in the Guppy model, such as causing:
- bone shards being flung into the near-side lung that would cause additional wounding;
- an immediate, rapid, and potentially catastrophic bullet expansion that would certainly affect the values of such metrics as V(ST) and L(T); and/or
- bullet tumbling that would likely affect all metric values.
Second, the 20% synthetic gel is not considered to be a theoretically “rigorous” testing medium, with properties considerably different than the FBI ordinance gel “standard”. Third, the Guppy model substitutes measured gel fractures for measurements of an actual hole/wounding around a hole. Fourth, the Guppy model assumes BST is relevant in quantifying wounding, a parameter Dr. Fackler may not have considered/included in his model. Finally, the metrics used to judge performance have been “invented” by an engineer with no health-care professional nor practitioner qualifications for doing so. All true.
Because of the limitations catalogued above, the Guppy model is empirical, rather than one that is both theoretically and analytically “rigorous”. An empirical model relies on approximations to strict modeling with theoretically precise calculations based on accepted science and engineering principles. Consequently, the model can only valid for approximately predicting an outcome. (For a detailed discussion of empiricisms, refer the eBook Chapter 6). If the empirical model should reasonably predict reality-based outcomes, the testing results can potentially be scaled to field-measured ones or strategically modified to allow a more direct correlation between test results and observed, field terminal performance.
The Guppy model is thus empirical and assumes “perfect” field application conditions that are not likely for the reasons cited above. Both the model and analysis are simplistic and approximative, at best. Nonetheless, the combined testing and model can result in common-denominator, baseline metric values for making assessments and judgements about potential pre-hunt outcomes as well as assessing actual hunt outcomes based on “qualitative parity” between the 300 SGK and the 30-caliber candidates.
The 300 SGK “standard” can reasonably be assumed to have breached bone and tumbled in its field applications. The variability of this process is likely reflected in the variability of the travel distance after the shot. The 30-calber candidates will likely do the same, also with a likely variable travel distance after the shot. These variable effects on wound cavity volume from both the 300 SGK and 30-caliber, candidate bullets are considered the same, and thus cancel out. In doing so, the bullets achieve field-related, qualitative parity. Furthermore, if all bullets on the management hunt breached bone and tumbled in a
Scott Fletcher Hunting Bullet Metrics 2023 Zebra Management Hunt Report 17
common animal, any observed field performance would also indicate a degree of qualitative parity. Consequently, a reasonable comparison between a metric’s gel test value and a selected performance measurement, such as maximum travel distance after the shot, could likely be made.
Acknowledging human nature, explaining why a heavier bullet from either Swift or Barnes was not considered is warranted. The primary reason is that the generic designs of both the Swift and Barnes bullets tested do not favor production of V(ST). As explained in eBook Chapter 14 (Barnes) and Chapter 16 (Swift), both designs have features that are judged as premeditated to limit the extent and rate of mushroom formation in order to enhance penetration. Limiting these deformations is likely the primary reason for the lower comparative magnitudes of V(ST) obtained in the gel tests. In the case of the Sierras, there are no design features (eBook Chapter 13) to limit these deformations and thus limit V(ST) values. In the case of the 200 WWC (eBook Chapter 15), only the rate of expansion is controlled by the bonding between the core and jacket, not the maximum extent of expansion. Allowing a bullet to expand as much as its impact velocity is capable of producing enhances the magnitude of V(ST).
In terms of V(ST), both the 180 SAF and 165 BTSX significantly trail the 200 WWC. The V(ST) value of the 180 SAF is about 34% less and the V(ST) value of the 165 BTSX is about 58% less. For the reasons discussed above, there would likely be only marginal improvement, at best, to the V(ST) results obtained with the 180 SAF and 165 BTSX if heavier bullets from each manufacturer had been tested.
A heavier Swift AF would have a reduced impact velocity at the test distance of 135 yards. The reduction of impact velocity was postulated to slow the rate of mushroom formation and mushroom diameter. As a result, both a longer L(S) and L(T) could be expected, likely increasing both V(ST) and V(T). However, any V(ST) increase was judged as not significant enough to be realistically competitive with the 200 WWC. At best, its estimated V(ST) value would likely only approach that of the under-predicted 220 SPH’s V(ST) value.
A heavier Barnes TSX shot from my 300 Winchester could be expected to have a higher impact velocity at 135 yards. However, as discussed in eBook Chapter 14, the TSX appears to have a premeditated design intent to limit the size of the mushroom formed, even at elevated impact velocities. If a Barnes TSX heavy enough to satisfy Criterion 1) had been tested, the resulting L(S), L(T), and V(T) test values would have been expected to noticeably increase. In terms of V(ST), L(Dmax) would be expected to decrease somewhat, Dmax could slightly increase, and L(S) would noticeably increase. The result would likely be an increase in V(ST), but assessed not to the extent of reasonably competing with the 200 WWC, the underpredicted 240 TSMK, or even the underpredicted 220 SPH.
Neither Swift nor Barnes offer published gel-test data (eBook Chapter 10) to confirm or refute these conceptual assessments of gel-test outcome.
Scott Fletcher Hunting Bullet Metrics 2023 Zebra Management Hunt Report 18
8.3.4 Criterion 3) Screening for the 200 WWC, 240 TSMK, & 220 SPH: Penetration Length Assessments
The metric L(T) in Table 2 was used to assess the total potential field penetration of all bullets. An L(T) value of 24 inches, obtained from the 300 SGK, was used as the standard. The 300 SGK was assessed to have always breached all near-side bones and passed completely through the thoracic cavity on broad side, front-quartering, and rear- quartering shots. It had exited animals more often than not from all shot angles, or had at least been retained by the far-side hide.
Criterion 3) stipulates that the penetration for all bullets must be “effective”. To do so, the bullet must completely breach the thoracic cavity and be at least retained by the far side-hide for all shot angles. A bullet completely exiting the animal from any shot angle is not required.
Since the 300 SGK had exited an animal more often than not and the penetration requirement was only that a bullet be retained by the far-side hide, the 300 SGK’s test penetration of 24 inches was judged to be more than adequate. Consequently, the 23 -inch L(T) value of the 200 WWC was judged to be “enough”. The 20-1/2-inch penetration of the 240 TSMK and 19-inch penetration for the 220 SPH were also judged to be potentially “enough”, particularly for a trophy bullet where rear-quartering shots that require greater penetration lengths to breach the thoracic cavity would typically not be attempted. In terms of either a trophy or management-hunt application, demonstrated field penetration of these bullets would be required for final judgement.
Terminal Performance Time # 3
Photo P-12 and Photo-17 combined with bullet-weight-retained data in Table 2 underscore that both the 240 TSMK and 220 SPH each lost about 40% of its weight during testing. Not acknowledging that reality with its potential terminal performance implications in the previous Criterion 3) discussion of penetration justifiably requires an explanation.
The issue associated with Criterion 3) is penetration, not what happens to the bullet during that penetration. The relevant point is that the test penetration lengths L(T) for both the 300 SGK “standard” and all 30-caliber candidate bullets were obtained at an impact velocity that was judged to be both compatible with each bullet’s generic design and representative of likely field impact velocities.
The test vs field impact velocity compatibility is important because each candidate bullet’s generic design must conceptually be capable of performing satisfactorily at the deformation stress imposed at field impact velocities representative of the test impact velocity. Such test vs field impact velocity compatibility is necessary to have confidence that the test results are reasonably representative of likely field results. If a candidate bullet loses 40% of its weight in achieving a test penetration at an impact velocity judged to be both compatible with its generic design and representative of field impact velocities, so be it. That weight loss does not diminish the relevance of a test penetration
Scott Fletcher Hunting Bullet Metrics 2023 Zebra Management Hunt Report 19
length comparison between a bullet judged to be “the standard” and any candidate bullet.
In addition to bullet weight loss, there are multiple sidebar issues that cloud assessment of likely field penetration based on the modeled testing in 20% synthetic gel. Such issues include the supposed “inferior” qualities of 20% synthetic gel compared to FBI ordinance gel and the fact that no bones that could significantly impede penetration were breached in the testing. Such unknowns only underscore the necessity of having a bullet of known field performance serve as the testing “standard” for comparison of all metric values. Consequently, such sidebar issues are considered to be speculative rather than substantiative, requiring actual field data to assess. Field data obtained to assess the fifth and sixth “Hunt Objectives” in section 5.0 of this report fundamentally address such sidebar issues.
8.3.5 Criterion 4) Screening for the 200 WWC, 240 TSMK, & 220 SPH: BSM Assessments
Criterion 4) specifies that the volume of BSM should be considered acceptable, as visually judged by an experienced PH during skinning-shed autopsies. The Guppy model indicates the obvious metric associated with BSM is also V(ST). Use of a bullet with a high V(ST) to produce a quick death, as specified by Criterion 2), could also lock in the attendant corollary of high BSM.
Review of Table 2 indicates that the bullet with the lowest V(ST) is the 165 BTSX. Indeed, use of Barnes TSX bullets by hunters in North America and Africa has resulted in an established reputation for meat preservation by demonstrably reducing the volume of BSM compared to bullets of other generic designs. However, its V(ST) magnitude is about 58% less than the 300 SGK’s. Such a disparity indicated either the primary performance objective of a balance between wounding and production of BSM was not possible, or another metric was potentially better at predicting the relative volume of BSM.
There are no obvious comparative test values with an attendant metric in Table 2 that indicate the likelihood of low BSM without the prospect of an extended travel distance associated with low wounding. The only metric judged to be potentially applicable is the violence index I(V), as its calculated value incorporates a modeled inference of bloodshot tissue.
The metric I(V) was created to qualitatively assess the potential debilitative “violence” associated with a bullet’s initial impact into tissue. Its magnitude was assumed to potentially indicate a bullet’s ability to produce a drop-to-the-shot reaction associated with some definition of “shock”. It is simply the ratio of the modeled bloodshot tissue volume, V(S), as identified by Guppy and defined in Guppy Tech, divided by a presumed volume of the actual bullet hole determined from gel fracture measurements.
Review of I(V) values in Table 2 indicates potential subjective agreement with this modeling approach. The I(V) for the 165 BTSX is 5.6, the lowest, by far. This low value is in keeping with its solid copper generic design with an inferred design intent to limit its expansion ratio. The I(V) for the 240 TSMK is 15.1, the highest, by far. The high I(V) of the 240 TSMK is expected/reasonable because its cup-and-core generic design, coupled with its thin, match-bullet jacket and metallurgically “soft” lead-alloy core, would tend to
Scott Fletcher Hunting Bullet Metrics 2023 Zebra Management Hunt Report 20
cause a grenade-like response upon impact. This grenade-like performance is reinforced by its L(S) value of 9-1/2 inches, the shortest of all the bullets tested.
As previously discussed, the extent of both the 240 TSMK’s and 220 SPH’s shrapnel beyond the radial fractures in the gel was not included in determining V(ST). This omission results in lower test values of V(ST) for both bullets. Because the extent of shrapnel was not included in determining V(ST), the calculated magnitude of I(V) for both bullets should be greater. Consequently, the I(V) values for both the 240 TSMK and 220 SPH catalogued in Table 2 likely underpredict a subjective appraisal of “violence” based on animal reaction and wounding.
This appraisal of I(V) test values indicates the values for both the 240 TSMK and the 220 SPH shown in Table 2 should be much higher. These likely higher values would represent the upper bound of all I(V) values presented in Table 2. The I(V) value of the 165 BTSX represents the lower bound of all I(V) values. This interpreted I(V) extreme leaves values for both the 300 SGK and 200 WWC “in the middle”. The question then became: “Does the 200 WWC’s I(V) of 10.2 indicate the likely potential for producing an acceptable volume of BSM?”
Subjectively, a reasonable answer is “no”. First, the meat damage produced by the 300 SGK had been judged by an Afrikaner hunter to be “too much”. Table 2 indicates the I(V) value of the 300 SGK is 9.6, lower than the 200 WWC’s value of 10.2. Second, the I(V) value of the 165 BTSX is about 45% less than the 200 WWC’s. The magnitude of this disparity also indicates the volume of BSM produced by the 200 WWC would also be judged as unacceptable. The only way to determine if the 200 WWC could produce an acceptable volume of BSM was from field assessments by a knowledgeable and experienced PH, based on skinning-shed observations.
9.0 Bullets Selected for Field Evaluations
9.1 General Discussion
As can be inferred from the previous evaluations, none of the candidate bullets reasonably passed muster as a management-hunt bullet. The values of both V(ST) and L(T) of the 200 WWC were comfortably comparable to the 300 SGK’s, indicating it could potentially be expected to produce a comparable travel distance as well as exhibit satisfactory penetration for use as a trophy bullet. However, there were no apparent metrics with attendant test values that indicated the 200 WWC would produce a “more-likely-than-not” acceptable volume of BSM compatible with a management bullet.
Both the 240 TSMK and 220 the SPH were essentially eliminated as management bullets because of the likely high volume of BSM implied by both the conservatively-modeled V(ST) and I(V). However, the conservative determination of V(ST) for both the 240 TSMK and the 220 SPH indicated that either might perform satisfactorily as a trophy bullet where meat damage was not a consideration. This application was dependent on their field penetrations being “enough”, as the L(T) values for both were less than the 300 SGK’s.
Scott Fletcher Hunting Bullet Metrics 2023 Zebra Management Hunt Report 21
All three were selected for field evaluation, recognizing that theoretically predicted performance is not the same as field reality. The field performance of all three would likely contribute to a better understanding of the theoretical Guppy model’s validity and provide a data base for any modifications. The following report sections present a summary review of each bullet, limitations on their use, and reasons for field testing them on thin-skinned, African plains game.
No concurrent field data were obtained from the 300 SGK. Such data would have been desirable to provide a basis for definitive comparisons of test metric values to field measurements for all bullets. However, a switch-barrel rifle was used to obtain both the 300 Winchester and 375 H&H gel-test data. Taking the additional hand-loaded ammunition and tools necessary for switching barrels in Africa was not feasible. Furthermore, the fees associated with the additional animals needed for the data and the expense associated with the time to hunt them were not considered reasonable cost additions to personally funded research that had no assurance of a satisfactory outcome.
9.2 220 WWC
Woodleigh, the manufacturer of the 200 WWC, has a recommended impact velocity range of 2000 to 2900 fps published on its website. As indicated in Table 3, impact velocities are expected to range from about 2300 to 2600 fps, well within this recommended range. However, Nathan Foster of Ballistic Studies has indicated that an impact velocity below about 2400 fps for a bonded, lead-core bullet produces terminal performance that is “less emphatic”. Consequently, a tentative hunt-strategy, shot-distance limitation of 280 yards was imposed based on that 2400 fps impact velocity. The EPGW for the 200 WWC at 280 yards is about 720 pounds, indicating satisfactory compliance with Criterion 1).
Evaluation of the gel-test metrics indicated it was the only bullet that had a test value of V(ST) reasonably comparable to the 300-grainer standard, and thus was assessed to have a reasonable chance of achieving Criterion 2). Its total penetration length, L(T), was only one inch less than the 300 SGK’s, and was thus judged to be satisfactory for all shot angles associated with a management bullet, including the rear-quartering shot. Consequently, it was judged to be in substantive compliance with Criterion 3). Lastly, the 200 WWC’s I(V) value of 10.2 indicated it might not be able to compete with the 165 grainer’s inferred ability to produce a low volume of BSM, but was worth a field evaluation.
9.3 240 TSMK
The 240 TSMK has a self-imposed, upper-bound impact velocity limitation rather than a lower-bound impact velocity limitation like the 200 WWC. This limitation is 2400 fps, based on field terminal performance assessments of a .375-caliber, 350-grain Sierra Match King (also with a hand-installed poly tip, as described in eBook Chapter 18). This limitation results in a hunt-strategy shot distance of greater than 220 yards.
The EPGW for the 240 TSMK at 220 yards is about 1030 pounds. For a maximum shot distance of 350 yards, the EPGW is about 980 pounds. Both game weight estimates satisfy Criterion 1).
Shots significantly beyond 220 yards will reduce its impact velocity below the impact velocity obtained in gel testing. Consequently, a corresponding decrease in V(ST) can be
Scott Fletcher Hunting Bullet Metrics 2023 Zebra Management Hunt Report 22
expected. Any reduced V(ST) could potentially produce travel distances slightly greater than 100 yards. That prospect was considered satisfactory, as the bullet was intended for use in a limited, long-range application in terrain and vegetation that would likely accommodate easily seeing where the animal actually dropped. Even with a reduction of field wounding from extended shot distances, there was no expectation of BSM being anywhere close to satisfactory. Field results with the poly-tipped 350 SMK indicated BSM with the 240 TSMK would likely be significant because of shrapnel associated with its cup-and-core generic design, thin match jacket, and soft lead core.
The likelihood of significant BSM indicated the 240 TSMK could only be realistically considered as a trophy bullet with the associated shot angles of broadside, full-frontal and front-quartering. This application was considered reasonable based on its total length of penetration, L(T), being only about 15% less than the 300 SGK’s.
Terminal Performance Time-Out #4
Match bullets without an accessory, poly tip are personally considered unsatisfactory for use as hunting bullets. Untipped match bullets, particularly the new-style VLD’s, have a long, extended nose with a very small-diameter tip (meplat) of only about 0.040 inches. This tip configuration is conceptually challenged to consistently and rapidly expand upon impact. Personal communication with a manufacturer of both match and hunting bullets indicates their match bullets expand only about 50% of the time when used on big-game animals.
Hunting videos sometimes indicate evidence of poor/delayed match bullet expansion. Animals, such as the North American pronghorn, can sometimes show little-to-no reaction when shot with an untipped match bullet. Videos can also show bullet exit wounds that appear to be only caliber diameter. Pictures/videos of clear synthetic gel blocks shot with untipped match bullets can indicate little-to-no/considerably delayed expansion compared to expected expansion and resulting wound cavity shape based on its generic design and personal gel testing.
The as-manufactured, 240 Sierra Match King (now obsolete) does not have a polymer tip. For the reasons just discussed, a polymer tip was manually installed to positively and consistently initiate bullet expansion every time upon impact.
The weight of the 240 TSMK could be considered by some to be “excessive”, particularly in the context of potentially needing only about a 200 to 220 grain bullet to fulfill the requirement of Criterion 1), as implied by Table 3. The reason for using such a “heavy” bullet is personal, based on the 240 TSMK’s generic design.
All match bullets are far more “fragile” than legitimate, cup-and-core hunting bullets because the metallurgy of both the jacket and the core is “soft” compared to the metallurgy of those components in true hunting bullets. Furthermore, match-bullet jackets are uniformly “thin” compared to the thickened, strategically tapered jackets of hunting bullets. The result of this metallurgy and jacket design is a match bullet can have much higher weight loss than a true cup-and-core hunting bullet of the same weight. Reducing any reduction of momentum that could potentially result from weight loss is reflected by the self-imposed, maximum impact velocity of 2400 fps.
Scott Fletcher Hunting Bullet Metrics 2023 Zebra Management Hunt Report 23
The implied “extra” weight of the 240 TSMK is a personal terminal performance safety factor, regardless of what a calculated estimated game weight might be using a lighter bullet and the 2400 fps impact velocity limit. The 240 TSMK’s additional weight is considered sacrificial in order to conceptually maintain momentum comparable to or greater than a lighter-weight hunting bullet once it penetrates into the animal. Furthermore, this extra, potentially sacrificial weight is considered as a reservoir for producing shrapnel to both enhance the degree of wounding and to create high-flow tributary bleeding pathways to the primary wound cavity created by the bullet.
9.4 220 SPH
Like the 240 TSMK, the Guppy model and related analyses indicated the 220 SPH could only be realistically considered as a trophy bullet. Its total length of penetration, L(T), was even less than the 240 TSMK’s. Just as with the 240 TSMK, however, this penetration length was assessed to be potentially “enough” for breaching the thoracic cavity on front-quartering, full-frontal, and broadside shots. It comfortably met Criterion 1), even at the extended ranges identified by the defined hunting problem.
The 220 SPH had both an upper- and a lower-bound impact velocity limitation. In keeping with criteria presented in eBook Chapter 13, its impact velocity on shoulder shots was to be limited to less than about 2550 fps. This upper-bound impact velocity indicated that any shot with a 220 SPH should be limited to greater than 100 yards. Shots less than 100 yards were highly unlikely based on the expected terrain, vegetation, and personal, terminally inept stalking “skills”. The EPGW for the 220 SPH at 100 yards is about 925 pounds and easily met Criterion 1).
Practioners like Foster typically indicate a lower-bound impact velocity for cup-and-core hunting bullets on the order of 1800 fps. However, a 2000 fps lower-bound impact velocity was selected in an attempt to have a wound cavity volume compatible with achieving a maximum travel distance consistent with Criterion 2). Such a lower-bound impact velocity indicated a maximum shot distance less than 300 yards. The EPGW for the 220 SPH at 300 yards is about 725 pounds and thus met Criterion 1).
Reduced impact velocities at ranges well beyond the gel test range of 135 yards meant corresponding reductions in V(ST). Such reductions indicated meeting Criterion 2) could potentially be in serious question. Like the 240 TSMK, there was no expectation of bloodshot meat being satisfactory because of the likely shrapnel volume associated with its cup-and-core generic design. So, why take a “tail-end Charlie” bullet with obvious limitations identified by the testing, analyses, and hunting-problem definition?
There are two reasons why this bullet was taken to Africa to assess its terminal performance. The first reason is it represents an old-school, Africa tried-and-true trophy bullet. Cup-and-core generic design. High sectional density (.331). Semi-pointed to round nose. Thickened alloy (likely tricked-out metallurgy) jacket with a cannelure. Designer-metallurgy lead core. Economical compared to all other tested bullets (the cost multiplier of the other 30-caliber bullets gel tested ranged from about 1.6 to 2.9). Speaking as a consulting professional engineer with over 45 years of experience, ignoring/disregarding any historical standard of “tried-and-true” would be considered a serious error and
Scott Fletcher Hunting Bullet Metrics 2023 Zebra Management Hunt Report 24
omission, particularly when the 220 SPH costs so much less than all the other tested 30-caliber bullets.
The second reason is the test data indicated the 220 SPH was potentially a legitimate, stealth trophy bullet under most hunters’ radar. As discussed in report section 8.2.3, the current Guppy model likely under-predicted its trophy-bullet potential for “stopping” an animal because the additional volume of wounding produced by its weight-loss reduction was excluded in its calculated volume of V(ST). Furthermore, its semi-spitzer, round-nose shape facilitates more rapid, potentially explosive mushroom formation, as indicated by its low L(Dmax) value of 4 inches identified in Table 2. This more-rapid mushroom expansion conceptually concentrates greater wounding in the near side lung and heart on broadside shots than would bullets with greater values of L(Dmax). If nothing else, the 220 SPH would likely provide the necessary wounding data required to assess if the extent of shrapnel beyond the gel fracture limits should be included in determining V(ST).
10.0 Field Procedures
10.1 Professional Hunter Qualifications
The PH was Craig Dewing. He has 24 years of experience as a professional hunter throughout Africa. That experience level is not common, and I was most appreciative of him sharing his demonstrated level of expertise. I want to thank my outfitter, Mr. Koos DeMyer of Kuche Safaris, for assigning Mr. Dewing as my PH for this management hunt.
Mr. Dewing impressed me as being an obvious student of his craft, a true professional in the best sense of the word. Please recognize that assessment is from a retired consulting, professional engineer, a judgement not easily earned. He could have easily blown me off as an esoteric crackpot, pandering to my explanations and judgements of terminal performance. Instead, he readily absorbed the relevant concepts, then asked challenging questions if he disagreed. Our discussions and the actual hunts can be characterized as a true, technology transfer. His questions about hydrodynamic (hydrostatic) shock generated a “eureka” moment about the physiological evidence associated with a bullet’s ability to produce shock that could be easily seen in the skinning shed.
10.2 Hunting Methods
Five hunts were walk-and-stalk, and five hunts were spot-and-stalk. No shots were taken from the truck. However, the truck was used on all spot-and-stalk hunts to drive the animals to an ambush point. Using the truck in this manner was the one philosophical concession made because of time constraints and the management nature of the hunts. The hunting pressure on the properties hunted was so intense that one glimpse of the truck caused the animals to instantaneously flee.
Mr. Dewing preferred to use Nordiske shooting sticks rather than two or three-legged ones. In the US, these sticks go by the brand name Seeland. On smooth, level ground, the hold from these sticks was judged to range from about ½ to no greater than 1 MOA. These sticks were used for all shots, as the rocky ground, woefully bad arthritic knees, and relatively tall grass precluded effective/efficient use of the seated bipod position in the extended-distance shot opportunities that were presented.
Scott Fletcher Hunting Bullet Metrics 2023 Zebra Management Hunt Report 25
Mr. Dewing used my Sig Sauer Kilo 2400 ABS laser range finder to determine both the target’s range and straight-line animal travel distance after the kill shot. If the animal was noticeably staggered and weaved erratically after the kill shot, Mr. Dewing paced the actual distance traversed by the animal. A Krestel 2000 wind meter was used to determine wind velocity, which typically ranged from about 6 to 19 mph.
There were three separate scope zeros associated with the three bullets. The zeros were obtained at 100 yards in the US at a temperature in the high 70’s. Chronographed muzzle velocities and published BCs were used to determine hunt zeros that ranged from 190 to 250 yards with no confirmatory targets at those distances. Confirmatory zeros at 100 meters were obtained in South Africa with temperatures in the high 30’s with swirling, gusty winds.
As discussed in report section 7.0, the aim point on the animals was intended to be the shoulder to obtain an upper-bound volume of BSM. The preferred shot angle was broadside. However, some hunts resulted in the zebras congregating/milling around in a herd such that front-quartering and rear-quartering shots were occasionally taken simply to get a shot on the PH-designated animal. Mr. Dewing described the typical herd melee as resembling schooling fish.
10.3 Skinning-Shed Autopsy Methods
The downed animals were immediately transported to the skinning shed where professional skinners removed the hide and unzipped the thoracic cavity for observation of the vital organs and carcass. The animals were hung by their rear legs, using a chain hoist supported sufficiently high enough to allow the animal’s head to be lifted completely off the concrete floor. All animals were processed and stored for human consumption.
The word “autopsy” is not used in its strictest, CSI/ medical-examiner, physiological sense. As applied to this management hunt, “autopsy” means checklist observations made by an engineer “looking at” (as opposed to “observing” as would a physician or veterinarian) and measuring specific things while playing the Sesame Street game of same and different.
The following list identifies primary, skinning-shed items of focus:
- Did the bullet exit or was it retained?
- If the bullet was retained, where was it retained?
- Was there a jacket-core separation?
- If there was a jacket-core separation, where were both the jacket and core found?
- What vital organs were affected?
- What was the actual hole size made by the bullet in the affected organ?
- What was the BST area surrounding the bullet hole in the affected organ?
- What and how many bones were breached?
- What was the qualitative volume of bloodshot meat that could be easily removed from the carcass to assess if that volume was satisfactory?
- Did the bullet plow straight?
- If the bullet did not plow straight, was it deflected laterally or vertically from its aim alignment?
- Was the bullet stopped by bone?
Scott Fletcher Hunting Bullet Metrics 2023 Zebra Management Hunt Report 26
- Did the bullet tumble?
- Was there any unusual bleeding?
- Was there any unusual tissue damage?
Dimensional measurements were made of organ wounds to the nearest 1/8 inch with a 3-feet retractable tape measure. Internal carcass measurements were also made with a phone utility to its tolerance of 1/2 inch.
BST typically occurred in an irregular shape. The shape was crudely approximated by assuming it to be an oval, rectangle, trapezoid, or triangle. Consequently, measurements were made accordingly.
No scales were available to weight the volume of BSM. The relative volume of BST that was carved away from the carcass was judged “by eye” to be either satisfactory or not by Mr. Dewing.
Multiple pictures were taken with an iPhone 14. Captions were added each day to document observations.
Both Mr. Dewing and the skinner were active participants in the autopsy process. Mr. Dewing identified features of note that were completely beyond any personal relevance indicators.
11.0 General Terminal Performance Results
11.1 Overview of Shots on Game
Fourteen shots were taken, of which ten bullets encountered vital organs and/or the spine/neck vertebrae. One animal (Z-4) required three shots, with two shots attributable to holdover error. Two animals (Z-6 and BWB) required two shots each, with one shot each attributed to zero issues. The remaining seven zebra required only one shot to cause them to expire. Subsequent report sections primarily discuss the ten “kill-shot” (KS) bullets needed for each animal and their performance on vital organs and/or the spine/neck vertebrae.
11.2 Kill-Shot Distances and Corresponding Impact Velocities
11.2.1 All Bullets
Table 4 identifies nine zebra and one black wildebeest that were taken at distances ranging from 119 to 324 yards, all from sticks. The average KS distance for all bullets was 214 yards.
11.2.2 200 WWC
KS distances for the five, 200 WWCs ranged from 119 to 284 yards, with an average of 176 yards. Corresponding impact velocities ranged from approximately 2658 to 2395 fps, essentially meeting or comfortably exceeding the desired minimum impact velocity of 2400 fps and maximum impact velocity of 2900 fps.
Scott Fletcher Hunting Bullet Metrics 2023 Zebra Management Hunt Report 27
11.2.3 240 TSMK
KS distances for the three, 240 TSMKs ranged from 271 to 324 yards, with an average of 290 yards. Corresponding impact velocities ranged from about 2350 to 2300 fps, demonstrably below the desired maximum impact velocity of 2400 fps.
11.2.4 220 SPH
KS distances for the two, 220 SPHs ranged from 151 to 234 yards, with an average of 193 yards. Corresponding impact velocities ranged from about 2300 to 2135 fps, falling well within the desired impact velocity range of 2550 fps maximum and 2000 fps minimum.
11.3 Kill-Shot Bullet Impact Energy
Table 4 identifies each KS bullet’s impact energy (IE), determined from known muzzle velocities, shot distances (SD), published BC’s, (200 WWC & 220 SPH) and a BC known to be representative (240 TSMK). For all bullets, IEs ranged from 2225 to 3134 ft-lbs, with an average IE of 2814 ft-lbs. For the 200 WWCs, the IEs ranged from 2545 to 3134 ft-lbs, with an average of about 2931 ft-lbs. For the 240 TSMKs, the IEs ranged from 2816 to 2940 ft-lbs, with an average of about 2894 ft-lbs. For the 220 SPHs, the IEs ranged from 2225 to 2582 ft-lbs, with an average of about 2404 ft-lbs.
11.4 Bones Breached by All Bullets
All bullets breached all bones encountered. Stated other ways: no bones stopped any bullet; no bullet was found terminated in bone. Bones breached included the near-side (NS) shoulder (scapula?), both the NS and far-side (FS) ribs, the spine, and neck vertebrae.
11.5 Specific Bones Breached by KS Bullets
11.5.1 All Bullets
Table 4 identifies bones breached. Four KS bullets (40%) breached the NS shoulder bone (scapula?), with no bullets breaching the FS shoulder bone. All four KS bullets that breached the NS shoulder bone breached at least one NS rib and penetrated through the thoracic cavity.
Nine (90%) KS bullets breached at least one NS rib, with five (50%) breaching multiple NS ribs. After breaching at least one NS rib, two (20%) KS bullets breached the spine, with both continuing on through the thoracic cavity to breach one FS rib. The five (50%) KS bullets that breached at least one NS rib breached at least one FS rib.
One (10%) KS bullet breached the NS shoulder bone, multiple NS ribs, and a FS rib. One KS bullet (10%) breached neck vertebrae.
Photo P-18 shows breaching of a NS shoulder bone (scapula?) and tissue on Zebra Z-3, shot with a 240 TSMK. The wooden dowel is pointing at a bone fragment removed from the hole made by the bullet in the shoulder bone. The hole is the dark area indicated by the thumb.
Scott Fletcher Hunting Bullet Metrics 2023 Zebra Management Hunt Report 28
Photo P-19 shows the interior of Zebra Z-1’s carcass, shot with a 200 WWC. Two NS ribs, the spine, and one FS rib have been breached. The dowel is aligned along the bullet’s aim path, and the dowel tip is pointing at the FS rib.
11.5.2 200 WWC
Three (60%) of the five KS bullets breached the NS shoulder bone. All (100%) breached at least one NS rib, with two (40%) breaching multiple NS ribs. After breaching multiple NS ribs, one (20%) breached the spine and continued on to breach 0ne FS rib. Of the four (80%) KS bullets that breached NS ribs but did not breach the spine, all breached the thoracic cavity, but none (0%) of these four encountered FS ribs.
11.5.3 240 TSMK
One (33%) of the three KS bullets breached the NS shoulder bone, multiple NS ribs, and one FS rib. One (33%) breached neck vertebrae. One (33%) breached one NS rib and one FS rib.
11.5.4 22o SPH
None (0%) of the two KS bullets breached the NS shoulder bone. Two (100%) breached multiple NS ribs. After breaching multiple NS ribs, one (50%) breached the spine. Two (100%) breached one FS rib.
11.6 Bullet Aim Alignment Deviation
11.6.1 All Bullets
Eleven bullets that breached bone were evaluated for aim alignment deviation, with the results shown in Table 4. Breaching NS bones (either shoulder or rib) caused two (18%) to deviate laterally from their aim alignment, and two (18%) to deviate vertically from their aim alignment. The two that deviated vertically were both deflected upward through the thoracic cavity and into the spine after initially encountering NS ribs. Both were then deflected vertically downward along the aim alignment, back through the thoracic cavity. Both bullets that were deflected downward by the spine breached a FS rib.
Six (55%) essentially plowed straight along their aim alignment. When asked an open-ended question about bullets being deflected from their aim alignment, Mr. Dewing stated that his experience indicated approximately 60% of all bullets did so. Thus, the aim alignment deviation of the bullets evaluated generally conformed to this expected average.
Photo P-20 and Photo P-21 show an example of lateral bullet deflection from the aim alignment caused by breaching of NS bones. Photo P-20 is of the bullet entrance hole on Zebra Z-3, shot with a 240 TSMK. The hole is “on the chevron” and is visible as a red dot directly beneath the shadow caused by the zebra’s ear. The shot angle was broadside. Photo P-21 is of the exit hole, off-set approximately 8 inches to the rear of “the chevron”.
Photo P-19 is also an example of vertical bullet deflection from the aim alignment caused by breaching NS rib bones. The dowel is aligned with the aim alignment, with the entrance
Scott Fletcher Hunting Bullet Metrics 2023 Zebra Management Hunt Report 29
hole on the right. The bullet was deflected upward by NS ribs into the spine, then deflected by the spine downward through a FS rib.
11.6.2 200 WWC
Four (80%) of the five KS bullets plowed along the aim alignment. Although plowing along its aim alignment, one (20%) KS bullet was deflected upward by a NS rib into the spine, breached the spine, then was deflected downward, breaching a FS rib.
Zebra Z-6 was shot with two bullets. After breaching a NS rib, the first bullet was deflected laterally, through the thoracic cavity, toward the rear of the animal. The second, the KS bullet, breached a NS rib and entered the thoracic cavity. The bullet was not recovered, and the aim alignment could not be determined.
11.6.3 240 TSMK
Two (67%) of the three KS bullets plowed straight along their aim alignment. One (33%) was deflected laterally toward the rear of the animal after breaching both the NS shoulder and multiple NS ribs.
11.6.4 220 SPH
Two (100%) of two KS bullets plowed along their aim alignment. Although plowing along its aim alignment, one (50%) KS bullet was deflected by NS ribs upward into the spine, breached the spine, and then was deflected downward, breaching a FS rib.
11.7 Kill-Shot Bullet Tumbling
11.7.1 All Bullets
As indicated in Table 4, breaching NS shoulder or rib bones caused seven (70%) of ten KS bullets to tumble, with three (30%) KS bullets assessed not to have tumbled.
11.7.2 220 WWC
Four (80%) of the five KS bullets were assessed to have tumbled.
11.7.3 240 TSMK
One (33%) of the three KS bullets was assessed to have tumbled.
11.7.4 220 SPH
Both (100%) of the two KS bullets were assessed to have tumbled.
11.8 Vital Organs Breached by Kill-Shot Bullets
11.8.1 All Bullets
Table 4 indicates nine (90%) KS bullets breached at least one lung. Eight (80%) KS bullets breached both lungs. In doing so, six (75%) of these eight KS bullets breached the heart or the plumbing directly above the heart.
Scott Fletcher Hunting Bullet Metrics 2023 Zebra Management Hunt Report 30
Photo P-22, Photo P-23, and Photo P-24 are of Zebra Z-7’s boiler room, breached by a 200 WWC. The bullet was assessed not to have tumbled. Photo P-22 is of the NS lung; Photo P-23 is of the heart; and Photo P-24 is of the FS lung.
Photo P-25, Photo P-26, and Photo P-27 are of Zebra Z-9’s boiler room, breached by a 200 WWC. The bullet was assessed to have tumbled. Photo P-25 is of the NS lung; Photo P-26 is of the heart; and Photo P-27 is of the FS lung.
11.8.2 200 WWC
Four (80%) of five KS bullets breached the NS lung. All of these bullets then breached the heart or plumbing directly above the heart as well as the FS lung.
11.8.3 240 TSMK
Two (67%) of the three KS bullets breached both the NS and FS lung. One (33%) breached the heart as well as the FS lung.
11.8.4 220 SPH
Both (100%) of the two KS bullets breached both the NS and FS lung. One (50%) breached the heart.
11.9 Direct Evidence of Bullet Shrapnel Wounding
Discussion of the gel-test results indicated both the 240 TSMK and 220 SPH produced shrapnel from bullet weight loss that occurred during passage through the gel. Direct evidence of shrapnel produced during passage of a 240 TSMK through tissue was identified during the skinning-shed autopsy of Zebra Z-3. Photo P-28 shows three shards embedded in the FS shoulder tissue. The dowel is pointing at the exit hole. Immediately above the dowel is a shard, with the intermediate shard less than ½ inch above it. The upper shard is plainly visible.
Photo P-29 shows at least six, identifiable copper jacket shards in Zebra Z-3’s FS lung, shot with a 240 TSMK. These shards were not recovered. The dowel is pointing at one of at least six holes made in the lung by shards besides the hole made by the bullet. The rectangular shape of the actual bullet hole just below the dowel indicates the bullet was likely tumbling. The actual bullet hole is significantly off-set from these shards, but these shards are within the periphery of discolored BST.
11.10 Indirect Evidence of Bullet Shrapnel Wounding
Photo P-30 shows the NS lung of Zebra Z-5, shot with a 220 SPH, and Photo P-31 shows Z-5’s heart and FS lung. Both photos indicate the tissue has been “shredded” to an appreciable degree. Based on the shards observed in the gel testing, this degree of tissue damage is interpreted to have been caused by the traverse of multiple lead core shards. However, no readily visible shards were observed in these organs. Furthermore, there was no retained bullet to confirm the presumed significant bullet weight loss responsible for the relative degree of shrapnel required to produce the wounding observed. This degree of tissue damage through the boiler room was not observed in any other animal.
Scott Fletcher Hunting Bullet Metrics 2023 Zebra Management Hunt Report 31
11.11 Wound Cavity Volumes Determined from Bloodshot Tissue Surrounding the Bullet Hole (TBSTV)
11.11.1 Measurements Made
Measurements were made in the skinning shed assuming the bloodshot tissue (BST) surrounding the bullet hole in both the lungs and the heart area comprised the wound cavity limits. These measurements corresponded to the Guppy wound cavity model, described in eBook Chapter 10. Volumes were computed assuming each inflated zebra lung was six inches wide, and each inflated lung of the BWB was five inches wide. The typical observed zebra heart width was about five inches. The black wildebeest’s heart was not breached.
The autopsies revealed that the BST was neither centered on the bullet hole, nor circular in shape, as modeled by the gel testing. These irregular geometries resembled ovals, triangles, trapezoids, and rectangles. These irregular geometries occurred regardless of bullet tumbling.
Photo P-32 shows the NS lung of the black wildebeest, shot with a 240 TSMK. The near-circular hole indicates little to no tumbling of the bullet had occurred. The BST bracketing the hole is essentially rectangular in shape, and the hole is not precisely centered in the rectangle.
Photo P-33 shows the NS lung of Zebra Z-2, shot with a 220 SPH. Visible is an obviously rectangular bullet hole assessed to have been caused by a tumbling bullet. Again, there is an essentially a rectangular-shaped BST zone bracketing the hole. The bullet hole is obviously not centered in the BST.
11.11.2 All Bullets
As shown in Table 4, lung bloodshot tissue volumes (LBSTV) were determined in eight (80%) animals. These volumes ranged from 133 to 374 cubic inches, with an average of about 258 cubic inches. Heart bloodshot tissue volumes (HBSTV) were determined in five (50%) animals. These volumes ranged from 24 t0 98 cubic inches, with an average of about 63 cubic inches. Total bloodshot tissue volumes (TBSTV) for both the heart and lungs ranged from 133 to 450 cubic inches, with an average of about 298 cubic inches.
11.11.3 200 WWC
LBSTVs were determined in four (80%) of the five animals taken with this bullet. These volumes ranged from 187 to 352 cubic inches, with an average of about 263 cubic inches. HBSTVs were determined in three (60%) animals. These volumes ranged from 24 t0 98 cubic inches, with an average of about 63 cubic inches. TBSTVs for both the heart and lungs ranged from 211 to 450 cubic inches, with an average of about 302 cubic inches.
11.11.4 240 TSMK
LBSTVs were determined in two (67%) of the three animals taken with this bullet. These volumes ranged from 133 to 374 cubic inches, with an average of about 254 cubic inches. HBSTV was determined in one (33%) animal. This volume was 63 cubic inches. TBSTVs
Scott Fletcher Hunting Bullet Metrics 2023 Zebra Management Hunt Report 32
for both the heart and lungs ranged from 133 to 437 cubic inches, with an average of about 285 cubic inches.
11.11.5 220 SPH
LBSTVs were determined in two (100%) of the two animals taken with this bullet. These volumes ranged from 162 to 342 cubic inches, with an average of 252 cubic inches. HBSTV was determined in one (50%) animal. This volume was 98 cubic inches. TBSTVs for both the heart and the lungs ranged from 162 to 440 cubic inches, with an average of about 301 cubic inches.
11.12 Wound Cavity Volumes Determined from Bullet Holes (TBHV)
11.12.1 Measurements Made
Measurements were made assuming only the bullet holes contributed to the wound cavity volume. No bloodshot tissue (BST) surrounding the bullet hole in the lungs and heart area was included. Volumes were computed assuming each inflated zebra lung was six inches wide, and each inflated lung of the BWB was five inches wide. The typical observed zebra heart width was about five inches. The black wildebeest’s heart was not breached.
11.12.2 All Bullets
Table 4 indicates lung bullet-hole volumes (LBHV) were determined in nine (90%) animals. These volumes ranged from 7 to 119 cubic inches, with an average of about 51 cubic inches. Heart bullet-hole volumes (HBHV) were determined in the heart area of six (60%) animals. These volumes ranged from 9 to 35 cubic inches, with an average of about 15 cubic inches. Total bullet-hole volumes (TBHV) for both the heart and lungs ranged from 7 to 131 cubic inches, with an average of about 61 cubic inches.
11.12.3 200 WWC
LBHVs were determined in five (100%) of the five animals taken with this bullet. These volumes ranged from 8 to 78 cubic inches, with an average of about 38 cubic inches. TBHVs were determined in four (80%) animals. These volumes ranged from 9 t0 35 cubic inches, with an average of about 18 cubic inches. TBHVs for both the heart and the lungs ranged from 12 to 96 cubic inches, with an average of about 52 cubic inches.
11.12.4 240 TSMK
TBHVs were determined in two (67%) of the three animals taken with this bullet. These volumes ranged from 63 to 79 cubic inches, with an average of about 71 cubic inches. TBHV was determined in one (33%) animal. This volume was 9 cubic inches. TBHVs for both the heart and the lungs ranged from 72 to 79 cubic inches, with an average of about 76 cubic inches.
11.12.5 220 SPH
TBHVs were determined in two (100%) of the two animals taken with this bullet. These volumes ranged from 7 to 119 cubic inches, with an average of about 63 cubic inches.
Scott Fletcher Hunting Bullet Metrics 2023 Zebra Management Hunt Report 33
TBHV was determined in one (50%) animal. This volume was 12 cubic inches. TBHVs for both the heart and the lungs ranged from 7 to 131 cubic inches, with an average of about 69 cubic inches.
11.13 Animal Travel Distances After the Kill Shot
The animals were segregated by both weight and vitals breached to evaluate travel distance after the KS. The combinations considered were animals whose spine or neck vertebrae were breached, animals that only had lungs breached, and animals that had both the lungs and heart/plumbing above the heart breached.
Table 4 indicates three (30%) of the animals, all zebras, had either their spine or their neck vertebrae breached. All dropped to the shot. Only one (10%) of the animals, the black wildebeest, had just its lungs breached. It traveled 108 linear yards after the shot. Five (50%) of the animals, all zebras, had both their lungs and the heart/plumbing above the heart breached. Travel distances ranged from 41 to 94 linear yards, with an average travel distance of about 66 yards.
One (10%) of the animals, Zebra Z-6, was debilitated by the first shot, then dropped to the second shot. The skinning shed autopsy indicated the only logical explanation for the zebra dropping to the second shot was because of hydrodynamic shock, as the second shot apparently did not breach a vital organ. Hydrodynamic shock will be defined in section 11.18, and the hunt circumstances associated with Z-6 will be discussed in section 11.20.
11.14 Animal “Amped” Just Before the Kill Shot
11.14.1 Basis for Assessment
A stress-induced elevated heart rate, with a corresponding elevated quantity of adrenalin in the animal just prior to the shot, could potentially affect travel distance and the frequency of shock-induced, instantaneous death. The stress level could be indirectly elevated by the frequency at which the animals were being hunted (hunting pressure), or by direct contact (hunters being detected by sight or smell) during the actual hunt. Such direct contact likely results in an animal being “amped” by an adrenalin dump. There was no realistic way to quantitatively assess each animal’s stress-induced physiological condition prior to or during the actual hunt.
As discussed in report section 10.2, all animals were judged to have been indirectly stressed by significant hunting pressure prior to this management hunt. This elevated hunting pressure potentially increased the “resting” pulse rate and may have increased any baseline level of adrenalin.
Qualitative assessments of actual hunt-induced stress were made for each animal taken. If they had run in response to seeing the truck, had seen us, or had winded us without at least a ½ hour recovery interval prior to the shot, they were assessed to be amped. If an animal required more than one bullet to produce its death, the animal was considered amped prior to the kill shot. The assessments are catalogued in Table 4 under AJBKS.
Scott Fletcher Hunting Bullet Metrics 2023 Zebra Management Hunt Report 34
11.14.2 All Bullets
Seven (70%) of the ten animals were assessed to be amped just prior to impact of the KS bullet.
11.14.3 200 WWC
Two (33%) of the six animals were assessed to be amped just prior to impact of the KS bullet. The effect of the animal being amped is interpreted to have affected travel distance after the kill shot. These circumstances will be discussed, in detail, in section 12.13.
11.14.4 240 TSMK
All (100%) of the three animals were assessed to be amped upon impact of the KS bullet. No effect upon travel distance after the kill shot was interpreted to have occurred.
11.14.5 220 SPH
One (50%) of the two animals was assessed to be amped upon impact of the KS bullet. No effect upon travel distance after the kill shot was interpreted to have occurred in this one animal.
11.15 Retained Bullet and Bullet Remnant Data
11.15.1 All Bullets
Five (50%) KS bullets exited the animals. Remnants of five (50%) KS bullets retained in the animals were retrieved for subsequent shop-determination of percent weight retained (WR), expansion ratio (ER), and percent deformation (Def). Table 5, Table 6, and Table 7 catalogue these values for the 200 WWC, 240 TSMK, and 220 SPH, respectively. Also shown in these tables are the retained bullet data obtained from gel testing.
11.15.2 220 WWC
Three (60%) of the five KS bullets were retained within the animals. As shown in Table 5, the weights retained (WR) range from 40 to 80 %, with an average of 56%. The expansion ratios (ERs) range from 1.29 to 2.11, with an average of 1.79. The deformations (Defs) range from 53 to 81%, with an average of 66%.
Photo P-34 shows a stock, 200 WWC bullet as well as all the recovered 200 WWC’s. Left to right: undeformed 200 WWC; bullet recovered from the test gel; bullet recovered from Zebra Z-1; bullet recovered from Zebra Z-7; and bullet recovered from Zebra Z-8.
11.15.3 240 TSMK
As shown in Table 6, only the jacket remnant of one (33%) of the three KS bullets was retained. This WR is 17%. The jacket is considered to be only a bullet remnant, not the actual deformed bullet. Consequently, there was no determination of ER nor Def.
Photo P-35 shows a stock 240 TSMK bullet as well as all recovered 240 TSMK’s. Left to right: undeformed 240 TSMK; bullet recovered from the test gel; remnant jacket
Scott Fletcher Hunting Bullet Metrics 2023 Zebra Management Hunt Report 35
recovered from the black wildebeest; and bullet shards recovered from Zebra Z-3’s shoulder muscle tissue directly beneath the FS hide. (Photo P-28)
11.15.4 220 SPH
As shown in Table 7, only one (50%) of the two KS bullets was retained. The WR is 58%. The ER is 2.29, and the Def is 54%.
Photo P-36 shows a stock 220 SPH bullet as well as the recovered 220 SPH. Left to right: undeformed 220 SPH; bullet recovered from the test gel; and the bullet recovered from Zebra Z-2.
11.16 Bullet Terminal Penetration Lengths
11.16.1 All Bullets
Terminal penetration lengths of nine (90%) KS bullets and one bullet that produced a wound in a vital organ are catalogued in Table 5, Table 6, and Table 7. Also included in these tables is a summary of the shot angles and bones breached for each bullet, as well as the penetration length for each bullet obtained during gel testing. Bullet penetration length measurements were made in the carcasses during skinning.
As will subsequently be discussed in section 11.20 one (10%) KS bullet retained within the animal is assessed to have produced hydrodynamic shock sufficient to instantaneously drop it, but produced no discoverable wound in any vital organ. Furthermore, this KS bullet could not be found during the autopsy.
11.16.2 200 WWC
As shown in Table 5, the 200 WWCs penetrated from 14-1/2 to greater than 29 inches. Four (80%) of five KS bullets were retained within the animals, with one (20%) exiting. Where the bullet was retained within the carcass, penetration lengths of three (60%) KS bullets ranged from about 14-1/2 to 20-1/2 inches, averaging about 17-1/2 inches. The kill-shot penetration length of one (10%) bullet was not determined, as will subsequently be discussed in section 11.20.
11.16.3 240 TSMK
As shown in Table 6, the 240 TSMKs penetrated from 4-1/2 inches (completely breaching a zebra’s neck vertebrae and entire neck) to greater than 19 inches. No (0%) bullets were retained within the animals, as there were no remnants intact enough to be considered a “bullet”. All three (100%) KS bullets exited the animals.
11.16.4 220 SPH
As shown in Table 7, the 220 SPHs penetrated from 17-1/2 to greater than 19 inches. One (50%) of the two KS bullets was retained within the animal, and one (50%) exited the animal.
Scott Fletcher Hunting Bullet Metrics 2023 Zebra Management Hunt Report 36
11.17 Quantity of Bloodshot Meat
11.17.1 Objective
Meat preservation is an important consideration for both the landowner on management hunts and the typical Afrikaner game hunter. Consequently, some hunters on management hunts place shots to the lungs, head, or neck to avoid any possibility of shoulder meat damage. The objective of this hunt was to place shots on the shoulder, if possible, to qualitatively assess if the volume of bloodshot meat (BSM) produced was considered by a knowledgeable PH to be acceptable.
11.17.2 All Bullets
The skinning-shed autopsies revealed irregular shapes and lack of symmetry of the BST surrounding the bullet holes. These same variabilities were evident in the assessments of blood-shot meat (BSM). Photo P-37 shows the bullet entrance hole on the carcass of Zebra Z-3, shot with a 240 TSMK. The trapezoid-shaped BSM on the shoulder is off-set above and extends to the rear of the actual bullet hole. Photo P-38 shows a highly-irregular shape of BSM on the dissected, FS shoulder of Zebra Z-5, shot with a 220 SPH. The majority of BSM is well below the bullet hole.
Six (60%) of the animals had kill-shots placed on the shoulder. Of those six shots, three (50%) produced a quantity of shoulder-meat damage assessed by Mr. Dewing to be unacceptable. Photo P-38 is an example of obvious BSM that was immediately judged by Mr. Dewing to be unacceptable.
11.17.3 200 WWC
Three (60%) of five KS bullets were placed on the shoulder. Of those three shots, all (100%) produced a quantity of blood-shot meat assessed by Mr. Dewing to be acceptable.
Photo P-39 is an example of a total volume of BSM removed from Zebra Z-9, judged to be acceptable by Mr. Dewing. The BSM at the top of the photo is from the NS shoulder; the BSM at the bottom of the photo is from the FS shoulder. The boots are shown for relative scale.
This photo was shown to a dedicated Afrikaner meat hunter present in the camp. The hunter concurred that the volume of BSM was acceptable.
11.17.4 240 TSMK
One (33%) of three KS bullets was placed on the shoulder. This shot produced a quantity of shoulder-meat damage judged by Mr. Dewing to be unacceptable.
Photo P-40 shows the unacceptable volume of BSM produced by a 240 TSMK on dissected NS shoulder of Zebra Z-3. Photo P-41 shows this BSM that was removed by the skinner, boots and width of boots for scale.
11.17.5 220 SPH
One (50%) of two KS bullets was placed on the shoulder. This shot produced a quantity of shoulder-meat damage judged by Mr. Dewing to be unacceptable.
Scott Fletcher Hunting Bullet Metrics 2023 Zebra Management Hunt Report 37
As previously discussed, Photo P-38 shows the BSM produced by a 220 SPH on the dissected far-side shoulder of Zebra Z-5. The volume of BSM on the NS shoulder was visually judged to be considerably greater. The volume of BSM on both the NS and this FS shoulder was so obviously excessive that it was not removed by the skinner for a photo.
11.18 Shock
11.18.1 Definition and General Discussion
I am no expert on “shock”. For that matter, I conclude from limited literature review that no one else is either when it comes to describing and explaining what a typical hunter claims is “shock”. I also conclude from reading published professional papers that actual experts who are physicians cannot agree on the physiological mechanisms nor even the physiological existence of what hunters have seen and “know” to be “shock”. Consequently, I believe I am equally unqualified to discuss this topic. This gives me license to define it, describe how it apparently affects the animal’s body based on both field and skinning-shed observations, and translate all of the above into advice hunters can actually use.
What will be described is not static, not even close. In the civil engineering profession, the word “hydrostatic” means constant, or nearly constant water pressure. Using this word to describe “shock” makes no sense because the passage of an expanding hunting bullet through tissue causes a violent, rapid, and transient pressure spike in the surrounding blood. This blood-pressure spike and its adverse effect on actual tissue and the animal’s involuntary nervous system are assessed to be the primary triggering mechanisms for the animal reaction of drop-to-the-shot hunters call “hydrostatic shock”. Consequently, the phrase chosen to describe and define this process is hydrodynamic shock.
The following definition of hydrodynamic shock is based on animal physiology discussed by Kevin Robertson in his second edition of The Perfect Shot, extensive conversations with Ira Wikel, a highly experienced and liscenced massage therapist considered to be unusually well-versed in the interaction of the nervous and circulatory system with associated muscle tissue, limited reading of internet literature authored by physicians, personal technical training as an engineer, personal (limited) hunting experience, and the recent skinning-shed autopsies associated with this zebra management hunt.
Hydrodynamic Shock definition: Hydrodynamic shock is a physiological process that produces variable, involuntary debilitation of both muscle and critical, life-support organs up to and including failure.
So, what is this process? A conceptual interpretation, based on effective stress and water flow through porous media principles fundamental to geotechnical engineering: a bullet entering and passing through tissue both destroys and displaces it. In addition to mechanically wrecking the cells it directly passes through, the bullet also displaces adjacent cells and the blood within these cells. Blood is incompressible, and it forces its way into adjacent cells trying to “make room” for the volume displaced by the
Scott Fletcher Hunting Bullet Metrics 2023 Zebra Management Hunt Report 38
bullet. Even though the adjacent cell membranes are porous and elastic, they simply are not porous nor elastic enough to accommodate the rapid volume increase of blood displaced by the bullet. The adjacent cells then rupture in response to this blood-pressure spike, causing what hunters know as bloodshot meat.
This blood displacement radiates orthogonally away from the bullet’s path, creating a blood compression wave. The blood pressure within this wave is abnormally high. Even though the pressure within the wave dissipates from progressive elastic expansion and permeation through cells farther and farther away from the bullet’s path, it can still get transmitted directly to the brain via the circulatory system with potentially enough pressure to mechanically rupture delicate cerebral blood vessels, potentially debilitating the brain sufficiently to cause a drop-to-the-shot reaction.
This abnormally high blood pressure within the circulatory system could also trigger the “fight or flight” reaction in the nervous system that is hard wired into the non-cognitive, involuntary response portion of the brain. The violence of the blood-pressure spike in the circulatory system is thought to be piezo-electrically transmitted to the nervous system and then to the brain by the vagus nerve. The vagus nerve is connected directly to the heart, and has multiple nerve endings in the respiratory area of the lungs. Thus, a bullet through the boiler room can transmit an immediate, uber-defensive condition through the circulatory system to the brain via the nervous system. The involuntary portion of the brain that serves as the receptor to this nervous-system stimulus tries its best to accommodate this “crimson alert” with such things as an adrenalin dump and instantaneous muscle contraction to initiate “fight or flight”.
This involuntary “fight or flight” response of the animal is assessed to cause a progressive degree of muscle-contraction violence that can be sufficient to induce another spike in the blood pressure of the animal. As with the blood-pressure wave directly induced into the circulatory system by passage of the bullet, this blood-pressure-induced spike from violent muscle contraction can get transmitted directly to the brain via the circulatory system where it can also mechanically rupture delicate cerebral blood vessels, producing a drop-to-the-shot reaction.
Evidence of progressive muscle contraction assessed to be violent enough to produce such an extraordinary blood-pressure spike was observed on numerous animal carcasses during the skinning-shed autopsies. This evidence was in the form of point-source “blood pimples” emanating from muscle tissue at various locations on the carcass. This muscle contraction was apparently violent enough to produce blood pressure sufficient to rupture the muscle cells that produced it, as indicated by this point-source bleeding. These point sources of bleeding were visible both on the muscle tissue itself and in attendant, blood-impregnation staining of the adjacent hide. The fact that the hide, itself, was blood stained further underscores the extraordinary degree of pressure in the circulatory system caused by this involuntary nervous system response. This muscle tissue-bursting response is defined as blood hammer (BH).
Photo P-42 shows Zebra Z-5, shot with a 220 SPH, in the process of being skinned. The BH is indicted by the irregular, circular blood splotches/staining on both the carcass and the hide in the shoulder and neck area. The bullet entrance hole is visible behind the shoulder. Photo P-43 is also of Zebra Z-5, and shows BH on the hide, the rear haunches, and the spine. With time, these ruptures in the muscle tissue freely weep blood, as
Scott Fletcher Hunting Bullet Metrics 2023 Zebra Management Hunt Report 39
indicated by Photo P-44. This photo is of the neck and the shoulder area of Zebra Z-2, shot with a 220 SPH.
The blood shown in the previous photos has NOT been caused by the skinning process, as indicated by neck and shoulder portion of both the hide and the carcass identified in Photo P-42, and the rear haunches and the spine-portion of both the hide and the carcass shown in Photo P-43. The staining occurrence and the shape of the stain indicate the hide had been stained with blood before the skinning had been begun.
Photo P-45 (Zebra Z-3, shot with a 240 TSMK) underscores that the staining of the hide occurs in response to what I am calling blood hammer rather than inadvertent tissue slicing from the skinning process. The picture shows a skinned carcass with virtually no bleeding either from the skinning process or the blood hammer.
The multiple carcasses observed throughout the hunt indicated an apparent progression in the severity of BH, suggesting a progression in the severity of shock. If BH occurred, it tended to be first evident on the neck, as shown in Photo P-46 (Zebra Z-4, shot with a 240 TSMK). As the inferred shock severity increased, the next portion of the carcass affected appeared to be centered along the spine. Subsequent increases in inferred shock intensity were indicated by BH spreading first to the shoulders, then to the rear haunches, as indicated in Photo P-47 (Zebra Z-5, shot with a 220 SPH). The most severe interpreted degree BH affected the neck, the back, the shoulder muscles, and the rear haunches of the carcass.
As previously indicated, Zebra Z-6 (shot with a 200 WWC) is the only animal judged to have expired due to hydrodynamic shock. Its carcass exhibited a significant degree of BH on its neck, shoulder, spine, and rear haunches. Photo P-48 shows BH on the back, the haunches and the carcass shoulder of Z-6; Photo P-49 shows BH on the neck and shoulder of Z-6; and Photo P-50 shows BH on the spine, the back, and the haunches of Z-6.
The degrees of adrenalin, respiratory rate, and power stroke of the heart are all variables that can conceptually affect the actual magnitude of the blood pressure in the animal at the time of bullet impact. As indicated by BH, stimulation of the involuntary nervous system associated with the vagus nerve could potentially produce varying degrees of muscle contraction that also likely contribute to a variability in blood pressure. The total variability in the blood pressure from the degree of adrenalin, respiratory rate, power stroke of the heart and involuntary muscle contraction all potentially result in variable debilitation of the animal, with the debilitation threshold of drop-to-the-shot apparently not easily achieved.
The generalized locations of this BH condition on each carcass are catalogued in Table 4. Also included in Table 4 is a qualitative assessment of whether the animal potentially had an abnormally high adrenalin and/or blood pressure at the time of the shot (amped). This condition is catalogued under AJBKS in Table 4.
Rather than piezo-electric stimulus from the circulatory system triggering violent, involuntary muscle contraction, direct mechanical disruption of the nervous system can also apparently trigger this contraction. Photo P-51 shows the exit neck wound of Zebra Z-4 where the 240 TSMK completely severed its vertebrae. Note the blood “weeping” from
Scott Fletcher Hunting Bullet Metrics 2023 Zebra Management Hunt Report 40
its eye, potentially indicating bursting of brain cells. Photo P-52 shows Zebra Z-4 being skinned, with BH on the neck freely weeping blood.
Bottom Line: the physiological mechanism(s) causing shock, by any definition, from an expanding hunting bullet wound is (are) likely primarily embedded in blood-pressure wave and blood/cell piezo-electric principles. The factors causing animal debilitation from shock are likely caused by the interaction of both the circulatory and the nervous system. These factors are highly variable, based on the animal’s physiological condition at the exact instant of bullet impact as well as the exact impact location of the bullet. This variability produces a corresponding variability in debilitation. Consequently, a drop-to-the-shot animal reaction, strictly from shock, is very unlikely.
11.18.2 All Bullets
As indicated in Table 4, eight (80%) of ten KS bullets produced skinning-shed evidence of what is judged to be varying degrees of shock, as indicated by what has been described as blood hammer (BH). Of the eight animals judged to have experienced shock, only one (13%) dropped to the shot.
11.18.3 200 WWC
Four (80%) of five KS bullets produced skinning-shed evidence of BH. Of the four animals that are judged to have experienced shock, only one (25%) experienced shock to a degree significant to cause it to drop to the shot.
11.18.4 240 TSMK
Two (67%) of three KS bullets produced skinning-shed evidence of BH. The frequency and intensity of BH on both animals indicated only a modest degree of shock had occurred. As previously discussed, field evidence observed on Zebra Z-4 indicated one (33%) of these KS bullets had likely caused extensive brain damage attributed to shock in addition to the BH indicated on the carcass’s neck.
11.18.5 220 SPH
Two (100%) of two KS bullets produced skinning-shed evidence of BH. The frequency and intensity of BH on both carcasses were extensive, as BH was observed in all four areas: neck, back, haunches, and shoulders. Zebra Z-2 dropped to the shot because its spine was breached. Zebra Z-5 exhibited BH to the same relative degree as Zebra Z-6, but did not drop to the shot.
11.19 Unusual Bleeding
There were four instances of what was interpreted to be unusual bleeding. The first occurred with Zebra Z-2, shot with a 220 SPH. Unzipping the thoracic cavity with an incision at the genitals produced actual blood flow that continued with the progressive extension of the incision along the belly toward the front legs. No pictures were taken while this bleeding was occurring, as I was fixated on trying to determine what physiological circumstances could be responsible for its occurrence. Furthermore, my skinning shed data base at the time was so limited that I had no idea if what I was observing was “unusual”. Mr. Dewing later said such bleeding was not common.
Scott Fletcher Hunting Bullet Metrics 2023 Zebra Management Hunt Report 41
Z-2 also had the most prolific external carcass bleeding associated with BH. Photo P-44 identifies the intensity of this bleeding that extended all the way back to the animal’s haunches.
The second instance of unusual bleeding occurred with the black wildebeest. The animal was shot broadside through the lungs with a 240 TSMK. Upon impact, it turned 90 degrees counterclockwise to flee. Mr. Dewing could clearly see blood spraying from the animal from over 270 yards, which he described as the most prolific he had ever witnessed. As shown in Photo P-53, there is extensive bleeding from FS exit holes as well as from the mouth. (the lower bullet hole was produced by an errant first shot due to zero issues) Photo P-54 shows the extent of bleeding on the ground after the black wildebeest had been loaded onto the truck. The black wildebeest was the only animal (10%) of the ten animals shot that bled through the mouth. Furthermore, the blood on the ground around the animal was the most extensive of all the animals shot.
The third instance of unusual bleeding occurred with Zebra Z-5, shot with a 220 SPH. When the animal was suspended in the skinning shed, the entrance bullet hole “peed” blood, as shown in Photo P-55, for approximately five minutes. Mr. Dewing remarked that both the occurrence and extent of such bleeding was unusual.
The fourth instance of unusual bleeding occurred with Zebra Z-7, shot with a 200 WWC. After the animal was suspended in the skinning shed, the first incision into the hide was made on its underside near the front legs, as shown in Photo P-56. The incision was on the same side of the animal as the entrance wound. Blood freely flowed from the incision, as indicated by the puddle on the floor in the photo.
11.20 Unusual Tissue Damage
Blood hammer (BH) is considered to be unusual tissue damage. As indicated in Table 4, BH occurred in eight (80%) of all the animals shot. All three bullets produce this condition to varying degrees. The 200 WWC produced BH in four (80%) of the five animals shot; the 240 TSMK produced BH in two (67%) of the three animals shot; and the 220 SPH produced BH in both (100%) of the animals shot.
In addition to BH, Zebra Z-6 had unusual tissue damage to one lung without wounding associated with a bullet hole. Photo P-57 shows the NS lung for the second, rear-quartering KS (FS lung for the first, initial shot). Note that this photo shows BST only. NO bullet hole is present, indicating no bullet reached the lung. Photo P-58 shows the NS lung for the first broadside shot (FS lung for the KS), with the thumb pointing at the bullet hole. As indicated by the photos, the BST in both lungs is similar in size and shape. Furthermore, the BST occurred at the same relative location in both lungs. The reason for this symmetrical, potentially sympathetic BST wounding is not apparent. The following narrative provides the background detail associated with this lung wounding and further unusual wounding associated with Z-6.
The first shot on Zebra Z-6 was with a 200 WWC at a distance of 284 yds. The animal was broadside, facing to the right. This first bullet hit low due to zero issues. The impact of the first shot caused little to no observable debilitation in the animal, to the point that the PH’s observing the shot wondered if it had even been hit. The wind was in our face attenuating the sound of the muzzle blast. This circumstance as well as the “casual”
Scott Fletcher Hunting Bullet Metrics 2023 Zebra Management Hunt Report 42
reaction of Z-6 (thankfully) caused no herd reaction to flee. The herd continued walking/grazing along its initial track, allowing us to move along a parallel track for the subsequent KS. The herd moved approximately fifty yards prior to the second shot.
The KS (second shot) was a left rear-quartering shot, also with a 200 WWC at 284 yds. The animal dropped upon bullet impact. Casual field assessment of the downed zebra indicated that the first shot had created a rip in the hide at the entrance point that was approximately 3-inches long. The first shot had apparently been radically deflected to the rear of the animal, and had exited on its far side (left side) near its haunch. The bullet’s exit had also created a rip in the hide that was about ½-inch long. Based on the entrance rip from the first shot, Mr. Dewing initially assessed that the bullet had somehow been deflected and had entered the animal sideways. Mr. Dewing indicated that such an extensive rip in the hide at a bullet’s entrance point was highly unusual.
The detailed skinning-shed autopsy indicated that the first bullet had not entered the animal sideways. Photo P-59 shows the first shot’s entrance wound on the right side of Z-6. Clearly visible is the prominent 3-inch rip in the hide. However, just to the left and centered on the rip is the actual hole in the hide caused by the first bullet (zoom magnification required). Also visible at the top and to the left of the rip are two less-pronounced rips, each about one-inch long, oriented at about 45-dergrees up and to the left. The dark, linear feature about 3-1/2 inches long, emanating from the bullet hole, is attributed to blood staining. Photo P-60 shows the circular bullet hole in the carcass made by the first bullet.
The reason for the near-rectangular-shaped hide staining to the left and above the rip shown in Photo P-59 is not known. The stain was not visible to the PH’s as a field- indicator of the first shot. There was no extensive, free-blood-sheet-flow noted in the field or in the skinning shed. As indicated in Photo P-60, there is little-to-no indication of blood hammer adjacent to and to the left of the entrance hole that could have been responsible for the staining. This hide staining only occurred in Zebra Z-6.
The autopsy indicated the first bullet breached the NS (right) rib (Photo P-61), clipped the NS lung (Photo P-62), began to tumble, unzipped the rumen (Photo P-63), then exited the FS hide sideways (Photo P-64, Photo P-65). The second bullet entered Z-6 (Photo P-66) leaving a circular hole in the hide (Photo P-67), breached a rib (Photo P-68), but created no wounding in any vital organ (Photo P-69). The KS bullet was not found in the intestinal detritus created by the first shot, and its trajectory inside the carcass could not be determined.
The following is a speculative explanation of how a 3-inch-long rip in the hide subsequently occurred at the first bullet’s entrance point in response to the second shot. It is based on skinning-shed observations of blood hammer and the initial, arched-back body configuration of a cat in an initial “fight-or-flight” situation.
The first shot into Z-6 produced a circular hole in the hide, creating a point of weakness (discontinuity). The second shot is interpreted to have produced hydrodynamic shock, as indicated by the extensive blood hammer identified on the carcass. As previously discussed in section 11.18, blood hammer is likely the result of extreme and violent muscle contraction/flexing. This contraction/flexing apparently produced enough muscle expansion to turn the entrance point of weakness in the hide into a rip.
Scott Fletcher Hunting Bullet Metrics 2023 Zebra Management Hunt Report 43
The orientation of the primary (3-inch long) rip and secondary, 45-degree rips indicates a very strong bursting/tensile force was applied to the hide. In terms of force vectors, its primary component, as indicated by the long, horizontal rip, was predominantly outward. Its secondary component, as indicated by the rips at 45-degree angles, was “up” toward Z-6’s back and “back” toward its haunches. Extreme flexing/contraction of the neck and shoulder muscles is conceptually responsible for the larger rip, with progressive contraction along the back, toward the haunches, conceptually responsible for the smaller, 45-degree rips. This rip pattern conforms to the skinning-shed interpretations of blood-hammer origin and progression discussed in section 11.18.
12.0 Discussion of Terminal Performance Results
12.1 The Effect of Kill-Shot Bullet Impact Velocities on Field Performance Interpretations
The primary purpose of the management hunt was to determine if Guppy-model test values had any predictive basis in terminal performance reality. In order to do so, bullet impact velocities had to be judged two ways:
1) Was the kill-shot bullet’s impact velocity consistent with its generic design and any arbitrarily imposed velocity limits so that reasonable conceptual judgements of field performance could be made?
2) Was the kill-shot bullet’s impact velocity within a range judged compatible with its gel-testing results so that either direct or empirical correlations could be made between the test value and field results?
Summary discussions in section 11.2 indicate the kill-shot impact velocities for each bullet used on the management hunt were within a range compatible with its generic design. Consequently, conceptual terminal performance assessments judged to be reasonable were made concerning each bullet’s field performance.
Guppy metrics V(ST), I(V), L(S), and L(T) were judged to be primarily important in either directly or empirically correlating gel-test results to field terminal performance results. In order for these test metrics to be reasonably used in making field correlations, field impact velocities had to fall within an arbitrarily selected velocity range. Field impact velocities within plus-or-minus 100 fps of each bullet’s test impact velocity were judged to be satisfactory for field correlations to be considered reasonably valid.
Field impact velocities were compared to test impact velocities after factoring in effects of elevation, barometric pressure, temperature, and humidity. Seven animals had kill-shot bullet impact velocities within plus-or-minus 100 fps of test impact velocities. These animals are Zebras Z-1, Z-7, Z-8, and Z-9, all shot with a 200 WWC; Zebra Z-3 and the black wildebeest, shot with a 240 TSMK; and Zebra Z-5, shot with a 220 SPH. Consequently, test values of V(ST), I(V), L(S), and L(T) were directly used in evaluating the field results obtained from these animals.
Scott Fletcher Hunting Bullet Metrics 2023 Zebra Management Hunt Report 44
Three animals had bullet kill-shot impact velocities that were in excess of 100 fps below their test impact velocities: Zebra Z-6 was shot with a 200 WWC at about 175 fps less than its test impact velocity; Zebra Z-4 was shot with a 240 TSMK at about 135 fps less than its test impact velocity; and Zebra Z-2 was shot with a 220 SPH at about 260 fps less than its test impact velocity. Consequently, test values of V(ST), I(V), L(S), and L(T) were indirectly used to conceptually evaluate field results obtained from these animals.
12.2 The Effect of Bullet Aim-Alignment Deviation on Terminal Performance
Eleven bullets initially breached bone (Table 4). Six (55%) were interpreted to have essentially plowed straight along their aim alignment. Of the five (45%) that did not plow straight along their aim alignment, there was only one instance (9% of the total; 20% of the misaligned) where this aim alignment deviation resulted in poor/marginal terminal performance. This poor terminal performance occurred with the first shot on Zebra Z-6. As previously discussed, this shot was radically deflected by a NS rib to the rear of the animal, breaching only the (then) NS lung. If Z-6 had fled in response to the shot, it could have traveled an exceptionally long distance, potentially making recovery problematic.
As discussed in section 11.6.1, the sample population of each bullet was judged to be so small that no comparison of aim alignment deviation among the bullets was made. Conceptually, bullets with long, tapered noses like the 240 TSMK are considered more susceptible to lateral deflection upon an off-center impact with a rib bone simply based on adverse geometry between the nose taper and the bone. A bullet with a tapered nose and comparatively low sectional density, particularly match bullets with extended noses, is particularly vulnerable. Bullets with relatively long tapered noses and generic design features that are intended to reduce the rate of mushroom formation, like the 200 WWC, are also considered to be conceptually more susceptible to lateral deflection because the bullet can be expected to have a significant degree of adverse taper in its nose when it encounters bone.
Regardless of conceptual considerations, a significant percentage of each bullet used on this management hunt was deflected to some degree. Consequently, the prospect of adverse bullet aim-alignment deviation due to breaching bone should be expected from all expanding hunting bullets in virtually every hunting scenario. Based on the composite results obtained on this management hunt, at least a 10% adverse aim-alignment deviation from any bullet impacting bone should be expected, potentially resulting in an unrecovered animal.
12.3 The Effect of Kill-Shot Bullet Shot Angle, Bone Breaching, and Tumbling on Field Penetration Lengths Through the Thoracic Cavity
Performance Criterion 3) (section 8.3.4) stipulates all bullets must have sufficient penetration to totally breach the thoracic cavity from broadside, front-quartering, and
Scott Fletcher Hunting Bullet Metrics 2023 Zebra Management Hunt Report 45
rear-quartering shot angles. To do so means the bullet must breach any bones encountered; have sufficient momentum to resist the effects of increased drag both from longer penetration distances associated with shot angles other than broadside and from any bullet tumbling; and compensate for any reduction in initial momentum caused by weight loss. The evidence for such penetration from a broadside, front-quartering or rear- quartering shot is that the bullet must at least be retained by the far-side hide.
Table 5, Table 6, and Table 7 present compiled retained bullet and penetration metric values, including those obtained from gel testing. There are eleven shots chronicled in these tables, but only ten entered an animal’s thoracic cavity. One shot completely breached the neck of Zebra Z-4, severing its neck vertebrae in the process (Table 6).
As previously discussed, the first shot on Zebra Z-6 (Table 5) was deflected to the rear of the animal by a near-side rib, breached both the near-side lung and rumen, then finally exited on the far side near the rear leg. The detritus created in the thoracic cavity from breaching the rumen was interpreted to be so extensive that the second shot (the one that produced the drop-to-the-shot reaction associated with hydrodynamic shock) did not exit the animal, nor was it retained by the far-side hide. Furthermore, this bullet was not recovered to assess its trajectory or enable an estimate of its actual penetration length.
The circumstances associated with this second shot into Zebra Z-6 are considered extraordinary. This occurrence is judged not to detract from the otherwise satisfactory penetration performance of the 200 WWC, as identified by the penetration obtained with the first shot on Z-6 and penetration data from all other zebras shot with this bullet (Table 5). Consequently, the ambiguous penetration results associated with this second shot have not been included in any penetration analysis.
All shots into the thoracic cavity initially breached bone. Other than the second shot on Z-6, nine completely breached the thoracic cavity, with five (56%) shots exiting and four shots (44%) retained by the far side hide. Of the nine identified shots through the thoracic cavity, seven (78%) tumbled. Because all bullets that breached the thoracic cavity either exited the animal or were retained by the far-side hide, tumbling was not interpreted to have adversely affected achieving “effective” penetration.
With the exception of kill shot on Zebra Z-6, the degree of penetration was also independent of shot angle for the 200 WWC (Table 5). Consequently, such penetration performance by the 200 WWC demonstrated Criterion 3) had been achieved.
For the 220 SPH, no penetration data were obtained from a broadside shot (Table 7). However, the 220 SPH had either exited a zebra (Z-5) from a rear-quartering shot with a penetration greater than the test penetration or was retained by Z-2’s far-side hide from a front-quartering shot at a penetration judged to be reasonably comparable to its test penetration. Such quartering shot angles are considered to be more penetration challenging, particularly a rear-quartering shot. Consequently, the 220 SPH was judged to have essentially satisfied the penetration requirements identified by Criterion 3).
Scott Fletcher Hunting Bullet Metrics 2023 Zebra Management Hunt Report 46
Penetration data for the 240 TSMK were only obtained from broadside shots (Table 6). However, both of its shots through the thoracic cavity (Z-3 and the black wildebeest) had exited. The bullet through Z-3 had been deflected to the rear of the animal (Photo P-21) to such a degree that it can be reasonably judged as equivalent to a front-quartering shot. With the black wildebeest, a 240 TSMK still managed to exit even while in the process of shedding its jacket. A 240 TSMK totally severing the neck vertebrae of Zebra Z-4 is judged as exemplary penetration performance, regardless of the limited penetration length.
Such demonstrated penetration supports a reasonable expectation that a 240 TSMK would at least be retained by the far-side hide on a rear-quartering shot. That expectation is further supported based on momentum considerations as applied to penetration results obtained from Zebra Z-8, shot with a 200 WWC (Table 5). The impact momentum for the 200 WWC is 74.4 ft-lbs. That momentum is equivalent to a 224-grain bullet impacting at about 2330 fps, the average impact velocity of the three 240 TSMK’s recorded in Table 6. That means that a 240 TSMK could literally shed a 16-grain jacket upon impact and still have a bullet weight available for the same impact momentum as the 200 WWC.
A cup-and-core bullet shedding its jacket instantaneously upon impact is highly unlikely, particularly at a sedate 2330 fps impact velocity. Based on an average impact velocity of 2330 fps, the momentum of the 240 TSMK upon impact would be about 79.9 ft-lbs., about a 7% increase compared to the 200 WWC.
The 200 WWC lost 60% of its weight in breaching the near-side shoulder bone and three near-side ribs of Z-8, the most rib bones breached in any animal on the management hunt. Its retained weight was about 80 grains. Even so, it still penetrated 17-1/2 inches. If a 240 TSMK lost 60% of its weight, its retained weight would be 96 grains, about a 20% increase over the retained weight of the 200 WWC. This comparative percentage weight loss between these two bullets conceptually indicates that the momentum of such a 240 TSMK would likely be more through an animal than the momentum of a 200 WWC, with the attendant expectation of increased penetration potential.
Based on momentum considerations just discussed, the 240 TSMK’s penetration performance on Z-3 and field performance on both the black wildebeest and Z-4, a realistic expectation of penetration for a 240 TSMK on a rear-quartering shot is that it would at least be retained by the far-side hide. Consequently, the 240 TSMK’s field performance is also judged to have essentially satisfied the penetration requirements identified by Criterion 3).
12.4 Comparison of 20% Synthetic Gel Total Penetration Lengths, L(T), to Field Penetration Lengths
No published data were available to assess if the test penetration in 20% synthetic gel, L(T), even remotely replicated actual penetration in an animal of substantive size. An empirical penetration performance standard considered desirable was observed penetrations of bullets retained within the animal should be comparable to greater than the penetrations obtained from testing in 20% synthetic gel. Field penetrations for retained bullets would be considered “comparable” if they were no more than about 10% less than test values when field impact velocities were compatible with each bullet’s generic design and within plus-or-minus 100 fps of each bullet’s test impact velocity.
Scott Fletcher Hunting Bullet Metrics 2023 Zebra Management Hunt Report 47
As discussed in section 12.1, all bullets had produced kill shots with impact velocities compatible with their generic designs. Bullets with impact velocities within plus-or-minus 100 fps of their test impact velocities had produced kill shots on seven animals. All of these kill shots were through the thoracic cavity. Two of the remaining three animals also had kill shots through their thoracic cavities. All associated penetration lengths were further evaluated to assess if a desirable empirical correlation existed between the field penetrations and test penetrations, L(T).
Table 5 identifies penetration data for the 200 WWC. All field impact velocities were compatible with the 200 WWC generic design and essentially conformed to the lower-bound, arbitrary impact velocity limitation of 2400 fps. Only Zebra Z-6 had a field impact velocity lower than the desired range (2395 fps vs 2470 fps). Regardless, the initial bullet into Z-6 penetrated greater than 29 inches, at least six inches greater than its test penetration even though a near-side rib was breached. This elevated penetration is attributed to a slower mushroom formation with a correspondingly smaller initial mushroom diameter that would otherwise be formed at a higher impact velocity. The reduced mushroom diameter results in less initial drag, allowing increased penetration.
Except for the extraordinary circumstances associated with the second shot on Z-6, all other penetrations noted in Table 5 were through thoracic cavities at impact velocities within plus-or-minus 100 fps of the test impact velocity. Penetrations obtained in Z-7 (20-1/2 in.) and Z-9 (>21 in.) for front-quartering shots are essentially comparable (within about 10%) to the test penetration even though both the near-side shoulder bone and one near-side rib bone were breached for both animals.
The field penetrations for both Z-1 (14-1/2 in.) and Z-8 (17-1/2 in.) were considerably less than the test penetration length of 23 inches. In both instances, these reduced penetrations reflect breaching multiple bones before the bullets were retained by the far- side hide. The bullet through Z-1 breached two near-side ribs and the spine. As with a neck vertebrae breach, a bullet breaching the spine is considered as the most difficult bone penetration that a bullet can accomplish. The bullet through Z-8 breached the near-side shoulder bone and three near-side ribs, the most ribs breached by any bullet on the hunt.
Table 6 identifies penetration data for the 240 TSMK. Both Zebra Z-3 and the black wildebeest had shots through their thoracic cavities. The field impact velocities for these shots were compatible with the 240 TSMK’s generic design and less than the arbitrary maximum impact velocity of 2400 fps. Furthermore, the impact velocities for both shots were within plus-or-minus 100 fps of the test impact velocity.
The bullet through Z-3 exited the animal after penetrating the near-side shoulder bone, two near-side ribs, and one far-side rib. Its penetration was thus greater than 19 inches, a length judged comparable to the test-penetration length of 20-1/2 inches. The bullet through the black wildebeest also exited the animal. Its penetration was thus greater than 15 inches. Fron inference, this penetration length is also considered at least comparable to the test-penetration length. The justification for this judgment is that the bullet’s impact velocity is essentially the same as Z-3’s. and is thus likely capable of a field penetration greater than 19 inches even after breaching more bones than those identified in the black wildebeest.
Scott Fletcher Hunting Bullet Metrics 2023 Zebra Management Hunt Report 48
Table 7 identifies penetration data for the 220 SPH. Both Zebra Z-2 and Zebra Z-5 had shots through their thoracic cavities. The field impact velocities for both shots were compatible with the 220 SPH’s generic design. The field impact velocity for the shot on Z-5 was within plus-or-minus 100 fps of the test impact velocity. However, the impact velocity for the shot on Z-2 was about 260 fps less than the test impact velocity.
The bullet through Z-5 exited the animal after breaching two near-side ribs and one far- side rib. Its penetration was thus greater than 19 inches, a length that would be greater than the test length of 19 inches.
Z-2’s penetration of 17-1/2 inches was comparable to the test penetration of 19 inches even though it breached two near-side ribs, the spine, and one far-side rib. The conceptual reason for this comparable penetration is the same as for the reason cited for the initial 200 WWC’s penetration through Zebra Z-6. The significantly reduced impact velocity conceptually results in slower mushroom formation and a smaller initial mushroom diameter that would otherwise be formed at a higher impact velocity. The reduced mushroom diameter results in less initial drag, allowing increased penetration.
The disparities between actual field penetrations identified in the tables and each bullet’s test penetration indicated that there was no apparent direct, quantitative empirical correlation between them. The identified penetration variables associated with bone breaching and bullet tumbling indicate that such a quantitative empirical relationship would be highly unlikely.
In initially evaluating the 30-caliber candidate bullets’ ability to achieve satisfactory penetration, their test penetrations had been qualitatively compared to the 300 SGK’s test penetration by using the word “enough” (section 8.3.4). Consequently, the penetration data in Table 5, Table 6, and Table 7 were evaluated to identify if there was any reasonable qualitative (rather than quantitative) empirical predictor relationship that could relate the gel test penetrations to the field penetrations.
The sample population for each bullet was judged to be so small that no comparison of L(T) among the bullets was made. The composite penetration data from the tables indicate that field penetrations through the thoracic cavity were comparable (within 10%) to greater than test penetrations seven (78%) of nine times when the field impact velocities were compatible with each bullet’s generic design. These data also indicate that field penetrations through the thoracic were comparable to greater than test penetrations in five (56%) of nine times when the field impact velocities were within plus or minus 100 fps of the test impact velocity.
Both penetration percentages just discussed indicate a “more-likely-than-not “outcome if L(T) obtained from testing in 20% synthetic gel is used to empirically predict a qualitative outcome of field penetrations. However, there is obviously greater confidence in this predicted outcome if only the compatibility of each bullet’s generic design with its field impact velocity is considered.
As indicated by these hunt data, a reasonable qualitative empirical relationship between field penetration and test penetration, L(T), appears to be field penetrations through a big-game animal’s thoracic cavity can be comparable to greater than the Guppy metric L(T), obtained from testing in 20% synthetic gel, when test
Scott Fletcher Hunting Bullet Metrics 2023 Zebra Management Hunt Report 49
impact velocities are representative of likely field impact velocities and field impact velocities are compatible with the bullet’s generic design. Under those velocity constraints, the test penetration L(T), obtained in 20% synthetic gel, apparently reasonably accounts for the effects of bullet tumbling and some reasonable degree of bone breaching.
12.5 Comparison of 20% Synthetic Gel Weight Retained and Expansion Ratio Data to Field Values
Having media-tested bullets produce test-bullet weight retained (WR) and expansion ratio (ER) data that can be considered representative to reasonably less than retained-bullet field data is also desirable. Such test data would provide the expectation that values of WR and ER obtained from bullets retained in the animal would be similar to greater than values obtained from the gel-tested bullets.
Study of Table 5, Table 6, and Table 7 indicates that only the 220 SPH (Table 7) had hunt bullet WR and ER values that were reasonably similar to greater than test-bullet values. The recovered 220 SPH bullet from Z-2 indicates a WR almost identical to the gel-tested bullet. Furthermore, the ER value of 2.29 is significantly greater than the test value of 1.83. This singular example appears to indicate that testing in 20% synthetic gel is a potentially reasonable and conservative way to evaluate expected field values of this bullet.
However, the 220 SPH has a cup-and-core generic design. Cup-and-core bullets are known to lose over 60% of their weight (WR = 40% or less) when subjected to very high impact velocities. In doing so, material that would otherwise potentially contribute to an enhanced ER is stripped away in the form of shrapnel. Furthermore, cup-and-core bullets are also prone to have highly variable values of WR and ER for both tested and field-retained bullets as discussed in section 8.3.3 and illustrated in Photo P-13. Consequently, the 220 SPH’s field WR value from Z-2 being similar to its test value and its field ER value being greater than its test value are both considered unrepresentative.
Bullet data for the 200 WWC (Table 5) indicate WR and ER values obtained from gel testing can be considered optimistic to highly unrepresentative of values obtained from bullets recovered from animals. WR values of bullets recovered from animals range from about 40% to 80% compared to the gel test value of 99%. The average weight retained of the recovered bullets is about 56 percent, almost half the value of the gel-tested bullet. ER values of bullets recovered from animals range from 1.29 to 2.11, with an average of about 1.79. This average value is about 18 percent less than the gel test value of 2.18.
Study of Table 6 indicates no actual 240 TSMK “bullet” was retained by any animal. However, a 240 TSMK shed its jacket on the far-side hide of the black wildebeest, with the lead core breaching the hide and fully exiting. Although the gel-tested bullet only had a weight retained of 59%, it did not shed its jacket from passage through the gel. Consequently, the gel test significantly misrepresented this bullet’s potential field performance by not demonstrating a jacket-core separation, performance considered by many to be a terminal performance “fatal flaw”.
Scott Fletcher Hunting Bullet Metrics 2023 Zebra Management Hunt Report 50
The data in Table 5 and Table 6 indicate that the gel test values 0f both WR and ER are typically not representative to reasonably less than field values. Stated in terms of field WR and ER values, field values of WR and ER are not representative to greater than test values obtained in 20% synthetic gel. As with the jacket-core separation in the black wildebeest, the gel-test data can significantly misrepresent actual field data.
The likely primary reason why test values of WR and ER are not representative of field values is that no bones were breached in testing. The generic designs of the 200 WWC, 240 TSMK, and 220 SPH conceptually indicate both the WR and ER test values would likely be considerably less than those obtained if bone had been breached during testing. Unlike the total test penetration length results in 20% synthetic gel being representative of field penetrations, test results for both WR and ER are apparently not representative. Bottom line: 20% synthetic gel-tested values of WR and ER that are obtained without breaching bone embedded in the gel can give test values that are not representative of field values, resulting in likely unrealistic expectations of their corresponding field performance.
12.6 The Effect of Bullet Weight Loss on Field Penetration and Observed Wounding
Both the 240 TSMK and 220 SPH are cup-and-core bullets. (eBook Chapter 13). This generic design is prone to produce high bullet weight loss because there are no design nor material provisions for truly preventing/ limiting the volume of shrapnel produced upon impact nor during passage through bone/tissue. The tendency for this generic design to lose weight during both testing and field application is clearly shown in Table 6 and Table 7. The magnitude of weight loss identified in these tables can be judged as at least “significant” to potentially “excessive”.
The 220 SPH had the least test penetration of all the candidate bullets (Table 2). Some could conclude that the reason for this comparatively poor penetration performance was due to its 40% weight loss, with a resulting expectation of potential poor/marginal field penetrations. Yet in Zebra Z-2, a 220 SPH penetrated through two near-side ribs, tumbled, then breached the spine and one far-side rib. In that process, it achieved a total penetration length within 1-1/2 inches of its test penetration length (Table 7). The animal dropped-t0-the-shot, and exhibited the most prolific carcass bleeding attributed to blood hammer of all zebras taken. In the case of Zebra Z-5, it penetrated over 19 inches, a length greater than the test penetration length. In doing so, it completely breached two NS ribs, the boiler room, and one FS rib. Weight-loss shrapnel was interpreted to have shredded the lungs and heart, resulting in prolific bleeding from the bullet entrance hole observed during skinning. Such demonstrated penetration and wounding from weight-loss-produced shrapnel in both Z-2 and Z-5 reasonably calls into question the legitimacy of using WR values obtained from media testing as a relevant indicator of either field penetrations or wounding.
Data obtained from the 200 WWC (Table 5) underscore this apparent paradox, but viewed from the perspective that field values of WR can also be used to inappropriately judge a bullet’s potential field performance. The high WR
Scott Fletcher Hunting Bullet Metrics 2023 Zebra Management Hunt Report 51
value for the 200 WWC obtained from the gel test can give the expectation of high values from bullets recovered from animals. However, WR values obtained from bullets retained on the far-side hide in either Zebra Z-1 or Z-8 can be interpreted as marginal to poor, resulting in a potential judgement that the 200 WWC somehow has flaws that will likely affect both penetration and wounding in some future, undefined application. Such a judgement about a bullet’s terminal performance indicates there has been no apparent recognition that the bullet in question penetrated “enough” and produced a recovered animal. The WR data simply reflect the b0ne breaching process required to produce that successful terminal performance, and will vary based on the type and number of bones breached. Furthermore, a bullet’s initial weight can be considered its shrapnel reservoir. Any bullet weight loss can be considered as shrapnel, with more weight loss likely producing enhanced wounding and high-flow bleeding tributaries.
In the case of Zebra Z-1, the 200 WWC produced drop-to-the-shot performance. To do so, it successfully accomplished a penetration-challenging, rear-quartering shot angle that also penetrated through two near-side ribs, tumbled, then breached the spine and one far-side rib, taking out the boiler room in the process. The retained bullet data of WR, ER, and Def reflect that bone-impeded performance. In the case of Zebra Z-8, the retained 200 WWC had a 60% weight loss, but passed the animal’s “trial-by-penetration combat” by breaching the near-side shoulder bone and three near-side ribs, then tumbled through the boiler room and was finally retained by the far-side hide. The retained bullet data reflect that challenging, bone-breaching performance, as well. The animal traveled less than 100 yards, meeting the exemplary maximum travel distance stipulated in Criterion 2) (section 8.3.3).
Data for the 240 TSMK (Table 6) underscore the issues presented in the discussion of both the 220 SPH and 200 WWC. As with the 220 SPH, the gel test value of WR could be considered by many as evidence of its second-to-last test penetration, with the attendant expectation of marginal to unacceptable field penetration. The jacket separating from the core in the black wildebeest, not indicated by the gel test, is a field performance metric that is typically never well received. Yet this shedding-of-the-jacket process did not prevent the “bullet”, even if it was just the lead core, from completely breaching, then exiting the animal. In the case of Zebra Z-4, this bullet completely breached neck vertebrae, excellent penetration performance by any measure. In the case of Zebra Z-3, this bullet breached the near-side shoulder bone and two near-side ribs, tumbled through the boiler room before breaching a far-side rib, then ultimately exited the animal. This bullet’s field penetration was greater than 19 inches in spite of breaching bone not modeled by the gel test. The travel distance for Z-3 was only 51 yards, the second-shortest of the hunt.
As previously discussed, there was direct, visible evidence of shrapnel wounding produced by the 240 TSMK in both Zebra Z-3’s lungs and its shoulder. The 240 TSMK was also used on the black wildebeest, and the shed jacket can be considered shrapnel. Such shrapnel is considered indirect evidence for the obviously conspicuous bleeding on the ground surrounding the BWB’s carcass and the conspicuous bleeding from its nose and mouth.
Scott Fletcher Hunting Bullet Metrics 2023 Zebra Management Hunt Report 52
These hunt data and skinning-shed autopsies just discussed indicate bullet weight loss did not inhibit/prevent effective bullet penetration through the thoracic cavity regardless of bones breached or shot angle. Furthermore, bullet weight loss that produced shrapnel is judged to have enhanced terminal performance by both increasing the degree of wounding and allowing free bleeding from vital organs along tributary wound pathways.
12.7 Kill-Shot Bullet Tumbling and Its Effect on Wound Cavity Volume
Nine (90%) KS bullets breached bone prior to entering the thoracic cavity, with the KS bullet breaching the neck vertebrae of Zebra Z-4 being the only exception. Breaching rib or shoulder bone caused seven (78%) of these nine bullets to tumble. The degree of tumbling was not uniform, as judged by the area of actual bullet holes in the lungs and heart observed during the skinning-shed autopsies. The varying degree of tumbling apparently caused a varying increase in both total blood-shot tissue volume (TBSTV) and total bullet hole-volume (TBHV) compared to the volumes produced if the bullet did not appreciably tumble.
Zebras Z-7, Z-8, and Z-9 illustrate the variability in wound cavity volume caused by bullet tumbling (Table 4). The KS bullet for all three animals was the 200 WWC. All three KS bullets had reasonably similar impact velocities, breached the NS shoulder bone, and breached NS ribs. These commonalities likely indicate a similar degree of expansion.
The KS bullet of Zebra Z-7 was judged not to have tumbled. The KS bullets of both Zebra Z-8 and Zebra Z-9 were judged to have tumbled. The TBSTV produced in Z-7 was about 211 cubic inches. The TBSTV produced in Z-8 was about 322 cubic inches, and the TBSTV produced in Z-9 was about 450 cubic inches, resulting in about a 53% increase in TBSTV for Z-8 and about a 113% increase in TBSTV for Z-9. The TBHV produced in Z-7 was about 19 cubic inches. The TBHV produced in Z-8 was about 38 cubic inches, and the TBHV produced in Z-9 was about 96 cubic inches, resulting in about a 100% increase in TBHV for Z-8 and about a 400% increase in TBHV for Z-9. These data indicate wound cavity volume, no matter how determined, increases due to bullet tumbling. The degree of increase is variable, likely dependent on the degree of tumbling.
12.8 Comparison of 20% Synthetic Gel Test V(ST) to TBSTV Determined from Skinning-Shed Autopsies
The gel testing performed was intended to serve as a basis for conceptually explaining/predicting bullet deformation characteristics and empirically predicting likely field terminal performance. The testing results were not expected to even remotely replicate the actual wound cavity volume of a hunting bullet in a big-game animal. No actual bone or ceramic material modeling the dimensions nor the strength characteristics of a “standard” bone was embedded in the gel to simulate the extreme bullet expansion with resultant fragmentation of both the bullet and the “bone”. Such an impact can be expected to result in a cavity “shape” (and subsequent volume) far different than the conceptual one identified as the Guppy. Furthermore, the 20% synthetic gel that was
Scott Fletcher Hunting Bullet Metrics 2023 Zebra Management Hunt Report 53
used has significantly greater resistance to penetration than FBI ordinance gel, a test medium developed specifically to simulate human tissue. Not only does 20% synthetic gel have greater resistance to penetration, its greater tenacity limits the extent of the radial fractures intended to model the bloodshot tissue limits. Consequently, the cavity volumes determined from skinning shed autopsies were expected to be significantly greater than the cavity volumes determined from the simplistic, “no-bone” testing in 20% synthetic gel.
For all the 30-caliber bullets evaluated, Table 4 indicates TBSTV is significantly greater than the corresponding V(ST) data identified in Table 2, as expected. For example, the TBSTV of animals shot with the 200 WWC is from about 900% to 1900% greater than the V(ST) determined from gel testing.
Data in both Table 4 and Table 2 were evaluated to assess if there was any reasonable scaler relationship (multiplier) between V(ST) values determined from testing and TBSTV values. The extreme variability of each bullet’s penetration through the animal (bones and number of bones breached, tumbling vs non-tumbling, varying volume of shrapnel produced, common organs breached) resulted in an extreme range of TBSTV for each bullet. Consequently, any calculated range of scaler values was assessed to be essentially meaningless, with no worthwhile predictive field application.
As previously discussed in section 11.11.1, the shape of the BST observed in the skinning shed was not circular nor centered on the bullet hole, as implied by the calculations in determining V(ST) from the test data. Skinning-shed measurements of the BST limits observed were considerably greater than even the Guppy metric L(Dmax). These skinning-shed observations underscored the same scaler issues as identified by the test V(ST) values compared to field TBSTV values. Consequently, any calculated range of scaler values associated with an equivalent diameter of BST was assessed to be essentially meaningless, with no worthwhile predictive field application.
As discussed in section 8.3.3, the calculated V(ST) from the gel tests did not include the radial extent of shrapnel for either the 240 TSMK or the 220 SPH. Such an omission was speculated to underpredict actual field wounding of these two bullets compared to the 200 WWC.
Using the 200 WWC that shot Zebra Z-9 as a comparative example, it produced the highest TBSTV of 450 cubic inches. However, the TBSTV obtained with a 220 SPH on Zebra Z-5 was 44o cubic inches, only 10 cubic inches less, about a 2 % reduction compared to about an 18 % reduction implied by the gel testing. The 240 TSMK exhibited similar TBSTV “over-achiever” status on Zebra Z-3, as its TBSTV was 437 cubic inches, only 13 cubic inches less, about a 3 % reduction compared to about a 13% reduction implied by the gel test.
For both the 220 SPH and 240 TSMK, the field wounding was essentially the same as the field wounding achieved by the 200 WWC. Not including the radial extent of shrapnel in calculating V(ST) did, in fact, result in underpredicting the field wounding capability of
Scott Fletcher Hunting Bullet Metrics 2023 Zebra Management Hunt Report 54
both the 220 SPH and 240 TSMK. Consequently, the radial extent of the shrapnel in the gel testing should have been included in calculating V(ST) for these two bullets to better represent their potential field terminal performance capabilities.
12.9 Comparison of 20% Synthetic Gel Test L(S) to Interpreted Field Values of L(S) Based on Skinning-Shed Wounding Observations
Identifying real-world relevance and any direct application of the Guppy metric L(S) to skinning-shed autopsy data was assessed to be primarily important. Data in Table 2 indicate that V(ST) comprises an average of about 95% of the total wound cavity volume, V(T), determined by gel testing for each of the three, 30-caliber bullets used on the management hunt. The limits of L(S) identify where this majority of modeled wound cavity occurs.
The skinning-shed autopsy data were evaluated to determine any spatial relationship between L(S) identified by the “Guppy” schematic and the thoracic cavity width of a big-game animal. Relevant questions are: “Where do the limits of L(S) actually fall within the animal”? “Is L(S) totally within the entire thoracic cavity, extending from the outside limits of the near-side lung, through the heart, all the way to the farthest limit of the far-side lung”? “Is L(S) shorter or longer than the thoracic cavity’s width”?
As previously discussed in section 12.4, the L(T) penetrations obtained in the 20% synthetic gel were judged to be representative to less than total field penetrations obtained in the animals. Table 2 indicates that the gel-modeled L(S) is about 37% (220 SPH) to 54% (240 TSMK) less than L(T), implying that the majority of the wound cavity is well within the thoracic cavity of the animals. In the case of the 200 WWC, its L(S) test length of 13-1/2 inches (Table 2) indicates a reality-based V(ST) could potentially be entirely within a zebra’s approximate 18-inch-wide thoracic cavity.
An indirect way to determine if the gel-model L(S) “fits” within the width of a big-game animal’s thoracic cavity would be to compare the NS lung’s entrance-wound area to the FS lung’s exit wound area. Because near-side bones were breached in all animals, extensive, unmodeled bullet mushrooming likely caused a significant increase in the NS wound area not indicated by the “mouth” of the Guppy schematic’s shape. If the gel-modeled L(S) was representative of the field cavity length within a big-game animal, the NS lung entrance-wound area should be significantly larger than the FS lung’s exit wound area due to degradation of the bullet’s mushroom diameter as it passes through the animal. This mushroom degradation is expected based on each bullet’s generic design.
Both lungs were collapsed due to perforation by the bullet. The NS lung’s wound area has been assumed to be the bullet’s entrance-wound area, and the FS lung’s wound area has been assumed to be the bullet’s exit wound area.
Table 8 summarizes the percent change in both bullet-hole wound area (BHWA) and bloodshot-tissue-wound area (BSTWA) between the NS and FS lungs based on skinning-
Scott Fletcher Hunting Bullet Metrics 2023 Zebra Management Hunt Report 55
shed measurements. Eight animals are listed, all of which had both lungs breached. A minus sign indicates a reduced percentage, meaning that the FS lung’s exit-wound area is smaller than the entrance-wound area of the NS lung at the percentage indicated. A plus sign indicates an increased percentage, meaning that the FS lung’s exit-wound area is larger than the entrance-wound area of the NS lung by the percentage indicated.
Six (75%) of the eight animals identified in Table 8 have the expected decreased bullet- hole-wound area (BHWA) between the near-side and far-side lungs. Zebra Z-7, shot with a 200 WWC, is an example of an expected large decrease in BWHA between the NS and FS lungs when a bullet does not tumble nor contribute to wounding from appreciable weight loss (WR = 80% as shown in Table 5). The decrease in wound area of 73% suggests a reality-based L(S) is largely contained within the thoracic cavity.
However, the KS bullet tumbled in five (83%) of those six. As indicated by the BHWA, bullet tumbling likely increased the bullet-hole area beyond a simple mushroom end area, apparently resulting in a reduction in the percent change. The average percent reduction in BWHA for these five animals is about 53%, 20% less than for Z-7 where the bullet was assessed not to have tumbled. This 53% reduction in wounding between lungs is not assessed to be representative of a reality-based L(S) being largely contained within the thoracic cavity.
In addition to tumbling, bullet weight loss appears to have also directly contributed to increasing BHWA between the NS and FS lung. Table 8 indicates the black wildebeest, shot with a 240 TSMK, had a 130% increase in wound area. The KS bullet was interpreted not to have tumbled. However, it was likely in the process of shedding its jacket before it passed through the FS hide. As indicated in Photo P-70, a jacket in the process of peeling away from its core potentially presents a considerably larger end area than that of an intact bullet in the process of mushrooming. (The intact bullet shown in Photo P-70 is the 240 TSMK retrieved from the gel test). The bullet’s likely larger jacket diameter, rather than its mushroomed core diameter, is interpreted to be responsible for producing this measured increase in hole area on the BWB’s FS lung. An increase in wound area of 130% indicates a reality-based L(S) would extend well outside a thoracic cavity.
The combined effects of bullet weight loss with bullet tumbling also appear to have contributed to increasing BHWV. Table 8 indicates the BHWA of Zebra Z-1, shot with a 200 WWC, has an increase of 19%. The fan-shaped hole in Z-1’s FS lung, as shown in Photo P-71, indicates the bullet significantly tumbled in response to breaching the spine, and appeared to have entered the FS lung sideways. This sideways entrance orientation significantly increased the measured wound area. This fan shape could also be representative of shrapnel spray after the bullet breached the spine. Table 5 shows this bullet lost 52% of its weight (WR = 48%). Photo P-72 shows the extent of the wounding in Z-1’s FS lung, interpreted to be largely attributed to shrapnel spray. As with the black wildebeest, this wounding increase indicates a reality-based L(S) would extend well outside a thoracic cavity.
Blood-shot-tissue-wound area (BSTWA) was also determined to assess the extent of a reality-based L(S). Seven animals had BSTWA data. Four (57%) of the animals identified
Scott Fletcher Hunting Bullet Metrics 2023 Zebra Management Hunt Report 56
in Table 8 have a decreased BSTWA between the near-side and far-side lungs. The KS bullet tumbled in three (75%) of those four, with a presumed effect of increasing the BSTWA beyond that of a bullet that did not tumble. The average percent reduction in BSTWA for these three was about 32%, appreciably less than the 53% reduction associated with the BWHA data for bullets that tumbled. As with the BHWA data, bullet tumbling indicates a reality-based L(S) that is likely not predominantly contained within the thoracic cavity.
Table 8 data also indicate bullet weight loss can contribute to an increase in wounding between the NS and FS lungs. Zebra Z-8, shot with 200 WWC, had a 20% increase in BSTWA between the NS and FS lungs. The bullet lost 60% of its weight, as indicated by the retained bullet data in Table 5. Again, such a wound area increase does not support a reality-based L(S) contained predominantly within the thoracic cavity
Although the majority of BHWA and BSTWA data indicate that the wounding in the NS lung is typically greater than the FS lung, the percent reduction in both wound areas between the lungs does not indicate that the wounding in the NS lung can be reasonably characterized as “significantly greater” than the FS lung when viewed in the context of the “Guppy” shape and the test values of V(ST) compared to the test values of V(T). The primary reason for this qualitative discrepancy appears to be because wounding can increase significantly due to bullet tumbling and weight loss from breaching bones. This bone breaching was not modeled in the testing, nor represented by the “Guppy” shape. Interpretation of skinning-shed wounding indicates the test L(S) typically underpredicts the relative lengthwise extent of primary wounding created by the bullet in an animal’s thoracic cavity. Consequently, the Guppy schematic is not representative of the field-determined wounding limits that can occur in an animal due to breaching bone and bullet tumbling.
Even with the enhanced wounding effects of bullet tumbling and weight loss, data in Table 8 indicate the wound area across a big game animal’s thoracic cavity, however determined, typically decreases with increasing bullet penetration length. Both the distribution and the rate at which this wound area decreases are variable, likely dependent on the extent/degree of both bullet tumbling and weight loss. Based on the skinning-shed autopsy data obtained, neither the distribution nor the rate of wounding decrease could be reasonably determined.
12.10 Comparison of 20% Synthetic Gel Test I(V) to Volume of Bloodshot Meat Determined from Skinning-Shed Autopsies
As previously discussed in section 8.3.5, I(V) is an empirical, concept-based metric to qualitatively assess the degree of potential tissue damage based on a simple ratio of modeled bloodshot tissue volume to modeled bullet hole volume determined from the Guppy model and 20% synthetic gel testing. Application of I(V) to skinning-shed observations is also empirical, requiring qualitative assessments of bloodshot meat
Scott Fletcher Hunting Bullet Metrics 2023 Zebra Management Hunt Report 57
volume both to judge its relevance and to establish a predictive expectation of performance.
The I(V) test value of the 165 BTSX (Table 2) potentially indicated a relatively low volume of BSM based on this generic design’s generally acknowledged field performance. The 200 WWC had an I(V) value of 10.2, the lowest of all the bullets that were field evaluated. This value is almost double the 165 BTSX’s value of 5.6. Such a disparity in magnitude legitimately called into question the 200 WWC’s ability to produce a satisfactory volume of BSM.
Data in Table 4 indicate the 200 WWC was the only one of the three bullets judged by Mr. Dewing to produce an acceptable volume of BSM from shoulder shots. This evaluation potentially indicates that if a bullet is tested in 20% synthetic gel at a test impact velocity that simulates likely field impact velocities, a I(V) value on the order of 10, as determined by the Guppy model, could likely produce a satisfactory volume of BSM from shots on the shoulder. Conceptually, bullets with I(V) values progressively less than 10 could be expected to produce progressively less BSM, and bullets with I(V) values progressively greater than 10 could be expected to produce progressively more BSM.
As discussed in report section 6.0, an Afrikaner hunter decreed that the 300 SGK had produced “too much” meat damage. Table 2 indicates the I(V) gel test value for this bullet is 9.6, only about 6% less than the 10.2 test value for the 200 WWC. Consequently, the I(V) values for both bullets are essentially the same. Based on this management hunt’s skinning-shed observations of BSM by a knowledgeable and experienced PH, the Afrikaner could have been a meat-preservation absolutist. This assessment is consistent with the Afrikaner’s assertion that a bullet with a solid copper generic design (eBook Chapter 14) similar to the 165 BTSX should be the “only” one used for plains game. Such a judgement underscores the potentially strident opinions hunters can have about meat damage. The actual I(V) value determining the boundary between BSM judged to be acceptable and BSM judged to be unacceptable is considered a subjective decision based on individual hunter performance criteria.
As discussed in report section 8.3.5, the test I(V) values in Table 2 for both the 240 TSMK and the 220 SPH were assessed to be unrepresentative because the extent of the shrapnel produced by these bullets had not been included in calculating their respective V(ST)’s. As discussed in section 12.8, the extent of shrapnel observed during testing should have been included so that test values of V(ST) were more representative of TBSTV’s identified in skinning-shed autopsies. The considerable volume of BSM produced by both the 240 TSMK and 220 SPH, as indicated by skinning-shed autopsies, underscores the requirement that gel test values of V(ST) include the extent of shrapnel that extends beyond the cavity’s fracture limits to obtain test values of I(V) that are more representative of likely field results.
Scott Fletcher Hunting Bullet Metrics 2023 Zebra Management Hunt Report 58
12.11 The Effect of Kill-Shot Bullet Wound Cavity Volume on Travel Distance
Determining if there was any relationship between the wound cavity volumes identified in the skinning-shed autopsies and the time to death, as indirectly indicated by travel distance at a uniform “sprint” speed, was fundamentally dependent on a common animal with common vital organs breached. There is no requirement that the same bullet be used. The gel testing clearly shows that the wound cavity volume produced is independent of weight and caliber (diameter), only dependent on each bullet’s generic design and impact velocity.
Only five animals, all zebras, met the commonality requirements previously stipulated. Z-7, Z-8, Z-9, Z-3, and Z-5 all had both lungs and the heart (or plumbing directly above the heart) breached by each KS bullet. All zebras “sprinted” in an attempt to flee in response to impact from the KS bullet. Z-7, Z-8, and Z-9 were all shot with a 200 WWC; Z-3 was shot with a 240 TSMK; and Z-5 was shot with a 220 SPH.
Graph 1 is a linear regression plot of travel distance (TD) after KS bullet impact vs total bloodshot tissue total volume (TBSTV) using the data of the five referenced zebras identified in Table 4. The resulting plot is a straight-line relationship based solely on the data from these zebras, with no trend-line extensions shown to determine either a travel distance intercept at no (zero) TBSTV, or a TBSTV intercept at no (zero, or drop-to-the-shot) travel distance (TD).
The calculated equation for the trend line shown on Graph 1 is TD = (-0.221) x (TBSTV) + 148. The computed correlation coefficient of the trend line is -0.92, indicating a very good correlation between TD and TBSTV even though the sample population of five animals is small. As a reference, a correlation coefficient of -1.0 would indicate a direct correlation between TD and TBSTV. The trend line shown in Graph 1 indicates a logical correlation between TBSTV and travel distance, with an increase in TBSTV resulting in a decrease in travel distance.
Graph 1 represents a trend line using data compatible with the Guppy model that assumed the fracture limits in the gel were the bloodshot tissue limits that could be identified in the skinning-shed autopsies. As discussed in eBook Chapter 10, Dr. Fackler may not have included what a hunter would describe as bloodshot tissue in his modeled wound cavity. Because of this concern, a linear regression, graphical analysis was performed to determine the relationship between travel distance (TD) after KS bullet impact vs total bullet-hole volume (TBHV) using data identified in Table 4.
Graph 2 is a plot of the refenced TD vs TBHV data. As with Graph 1, the plot is a straight-line relationship based solely on the data from these five zebras, with no trend-line extensions shown to determine either a travel distance intercept at no (zero) TBHV, or a TBHV intercept at no (zero, or drop-to-the-shot) travel distance. The calculated equation of the trend line is TD = (-0.52) x (TBHV) + 103. The computed correlation coefficient of this relationship line is -0.93, virtually identical to the correlation coefficient calculated for Graph 1 that used TBSTV data instead of TBHV data. As with the correlation coefficient computed for Graph 1, the correlation coefficient of -0.93 indicates a very good correlation between TD and TBHV. The trend line also indicates a
Scott Fletcher Hunting Bullet Metrics 2023 Zebra Management Hunt Report 59
logical correlation between TBHV and travel distance, with an increase in TBHV resulting in a decrease in travel distance.
The coefficient of variation, CV, was computed for both the TBSTV data used in Graph 1 and the TBHV data used in Graph 2. CV is a numerical way to compare data sets to assess which one has less scatter associated with a trend line relationship. Data with a lower CV value indicate less data scatter and therefore better confidence in predicting an outcome from the trend line.
The computed CV for the TBSTV data for Graph 1 is 28%, and the computed CV for the TBHV data on Graph 2 is 63%. The significantly lower CV using the TBSTV on Graph 1 indicates TBSTV is apparently a better statistical predictor of travel distance than one that uses the TBHV data.
The trend lines for both Graph 1 and Graph 2 logically identify that travel distance after the kill shot linearly decreases with an increase in wound cavity volume, no matter how determined. Assuming a reasonably common sprint speed associated with that travel, both graphs support Dr. Fackler’s conclusion that time to death is directly related to wound cavity volume, with a larger wound cavity volume resulting in a shorter time to death.
12.12 The Effect of an Animal Being Amped on Travel Distance
Empirical evidence suggests the physiological condition of the animal just prior to the shot could potentially affect its time to death, even if its boiler room is breached by an expanding hunting bullet. For example, the Philippine Moros, amped by either opium or extracts from local vegetation known as sugapra, were so difficult to stop that it prompted the US military to adopt the 45-caliber M1911 pistol, abandoning the 38-caliber M1892.
The substitute for such drugs in an animal could potentially be adrenalin. Animals assessed to have adrenaline elevated above some unknown baseline level associated with “alert” were considered to be “amped” just prior to the shot. This potential condition is catalogued in Table 4 under AJBKS. An elevated adrenalin level could conceptually allow an animal to travel a distance inordinately long relative to its wound cavity volume.
An example of this outcome is interpreted to have potentially occurred. In the following example, both animals were shot with the 200 WWC at virtually the same impact velocity. Both bullets breached both lungs and the heart of a zebra. Zebra Z-7 was assessed not to be amped at the time of the shot. Its TBSTV was 211 cubic inches, and it traveled 94 yards after the shot. Zebra Z-8 was assessed to be amped at the time of the shot. Its TBSTV was 322 cubic inches, about 53% greater than the TBSTV of Z-7. Based solely on this greater wound cavity volume, Z-8 would logically be expected to travel a shorter distance than did Z-7. Yet Z-8 traveled 92 yards, virtually the same distance as Z-7. This disparity in travel distance vs wound cavity volume is attributed to the presumably increased adrenalin in Z-8.
In addition to adrenalin potentially extending an animal’s travel distance relative to the volume of the wound cavity, it could also potentially decrease it. An elevated adrenalin level also logically increases the animal’s blood pressure and pulse rate. These animal
Scott Fletcher Hunting Bullet Metrics 2023 Zebra Management Hunt Report 60
physiological conditions increase the frequency of the heart’s blood-pumping power strokes. The increased frequency of a heart power stroke logically increases the odds of achieving a coincident impact of the bullet. Such a coincident impact would spike the already elevated blood pressure to a threshold potentially necessary to burst neurologically sensitive cells. Furthermore, increased blood pressure in the animal likely allows a greater opportunity for a catastrophic pressure spike beyond the exact, instantaneous occurrence of the power stroke, potentially resulting in a drop-to-the-shot reaction.
Such an elevated blood pressure condition could account for the paradoxical drop-to-the-shot reaction of Zebra Z-6 with no apparent wounding of vital organs from the kill shot. During the stalk, Z-6 was assessed not to be amped. Although the animal reaction to the initial shot indicated no increase in physiological stress, the resulting adrenalin dump likely significantly increased its blood pressure and heart rate. The second shot’s inferred “luck-of-the-draw” bullet impact that was potentially coincident or nearly coincident with the heart’s power stroke could have spiked Z-6’s blood pressure beyond some critical physiological level, causing an immediate drop-to-the-shot-reaction.
12.13 The Effect of Kill-Shot Bullet Impact Energy on Travel Distance
Impact energy is generally acknowledged as the primary metric for assessing a bullet’s lethality. Progressively higher impact energy is thought to be associated with progressively greater wounding potential and a progressively shorter time to death. Consequently, progressively higher impact energies should logically produce progressively shorter travel distances after bullet impact, up to and including a drop-to-the-shot reaction.
Liner regression calculations were performed to identify the relationship between KS bullet impact energy and travel distance after KS bullet impact. As with the wound cavity vs travel distance relationship determinations, data for Z-7, Z-8, Z-9, Z-3, and Z-5 were used.
Graph 3 is a linear regression plot of impact energy (IE) versus travel distance (TD) using the attendant data identified in Table 4. As with Graph 1 & Graph 2, this plot is a straight-line relationship based solely on the data from these zebras, with no extrapolations to determine either a travel distance (TD) intercept at no (zero) IE, nor an IE intercept at no (zero, or drop-to-the-shot) travel distance. The calculated equation for this relationship line is TD = (0.04) x (IE) - 51. The computed correlation coefficient of this relationship is 0.53.
If greater impact energy results in a shorter time to death, a “logical” trend line for Graph 3 would show that as the impact energy increases, the travel distance decreases. However, the trend line of Graph 3 shows the opposite relationship: as a KS bullet’s impact energy increases, the travel distance also increases. This trend line is in direct disagreement with the expected, “logical” terminal performance outcome. For context, Zebra Z-5’s KS bullet had the lowest impact energy of the five zebras evaluated, yet had the shortest travel distance. If accepted doctrine concerning
Scott Fletcher Hunting Bullet Metrics 2023 Zebra Management Hunt Report 61
impact energy is valid, Zebra Z-5 should have traveled the greatest distance of the five zebras.
In addition to Graph 3’s TD vs IE trend line relationship being fundamentally incorrect, it has a correlation coefficient of 0.53, indicating considerable data scatter. Even if the relationship trend line had been correct, a correlation coefficient of 0.53 indicates the relationship between TD and IE is essentially equivalent to a coin toss.
12.14 The Effect of Kill-Shot Bullet Impact Energy on Producing Hydrodynamic Shock
Bullets with high impact energy are thought to be necessary and responsible for producing hydrodynamic (hydrostatic) shock. Such “shock” is attributed to producing a drop-to-the-shot animal reaction.
Zebra Z-6, shot with a 200 WWC, was the only animal that had a drop-to-the-shot reaction attributed to “shock”. As discussed in report sections 11.18 and 11.20, Z-6 was interpreted to have expired solely due to hydrodynamic shock, as there was no visible, associated wounding identified in the skinning shed that could be attributed to that response. The carcass exhibited pronounced/significant blood hammer on its neck, back, haunches and sides. The occurrence and magnitude of this blood hammer were interpreted to have been caused by hydrodynamic shock, as previously defined and discussed in report section 11.18. However, the impact energy of the KS bullet was only 2545 ft-lbs. This impact energy was the lowest, by far, of the five 200 WWC KS bullets (Table 4). Furthermore, this impact energy was the 9th lowest (next to last) of the ten kill shots, indicating no apparent relationship between bullet impact energy and a drop-to-the-shot reaction.
Only two other animals exhibited the same degree of shock-induced blood hammer on their carcasses: Zebra Z-2 and Zebra Z-5. Both were shot with a 220 SPH. The impact energy of the KS bullet on Z-2 was 2225 ft-lbs., the lowest of all the KS bullets. This animal dropped-to-the-shot, but the reason was its spine was breached. The impact energy of the KS bullet on Z-5 was 2582 ft-lbs., the 8th lowest (second to last) of all KS bullets. This animal did not drop-to-the-shot, but traveled only 41 yards afterwards.
The KS bullet with the highest impact energy of 3134 ft-lbs. (Table 4) was used to take Zebra Z-9, shot with a 200 WWC. Only very slight blood hammer was observed on its neck, potentially indicating only modest shock. The KS bullet used to take Z-7, also a 200 WWC, had an impact energy of 3034 ft-lbs., the 2nd highest of all KS bullets. However, no blood hammer indicative of shock was observed on its carcass. The KS bullet used to take Z-3, a 240 TSMK, had an impact energy of 2927 ft-lbs., the 6th highest. As with Z-7, no blood hammer indicative of shock was observed on its carcass. These field observations indicate impact energy likely has little-to-no relevance in producing either tissue-related debilitation associated with “shock”, as indicated by blood hammer on the carcass, or a drop-to-the-shot reaction.
Scott Fletcher Hunting Bullet Metrics 2023 Zebra Management Hunt Report 62
12.15 Terminal Performance Implications Suggested by Graphs 1 & 2
Both Graph 1 and Graph 2 indicate a statistically significant relationship between travel distance and wound cavity volume. This relationship appears to be valid whether the cavity volume is determined from bloodshot tissue volume or bullet-hole volume.
The data points comprising these trend lines were produced by three, 30-caliber bullets with three different weights and two different generic designs. Like the .375-caliber, 300 SGK standard, each produced a cavity volume in the gel based on its generic design and impact velocity. These trend lines indicate that time to death, as indirectly indicated by travel distance, is a linear relationship only dependent on wound cavity volume, independent of bullet weight and bullet caliber.
The implication of the previous conclusion is that bullets of different generic designs both smaller and larger than 30-caliber, shot from their attendant chamberings, could have produced travel distances less than 100 yards. Such an inference is correct. However, the maximum travel distance of 100 yards was only one of four terminal performance criteria identified in section 8.3.1. In order for any alternative bullet with attendant chambering to be reasonably considered, gel testing and analyses in the context of the defined hunting problem and a known bullet standard should be performed. Evaluation of all gel-test metric values is required to rationally select the bullet with the attendant chambering that can likely achieve all stipulated terminal performance criteria.
As previously discussed, the linear trend lines shown on both Graph 1 & Graph 2 have not been extended to either axis to identify a wound cavity volume at “zero” travel distance, nor a travel distance associated with “zero” wounding. “Common sense” dictates that the travel distance associated with zero wounding would be indeterminately/infinitely long, indicating that trend lines of both graphs should begin to curve upward asymptotically at some point and never intersect the travel distance axis. No effort has been made to assess where that upward curvature begins, nor what that curve looks like.
However, extending the trend line of either graph to a travel-distance-equals-zero condition is not considered as an esoteric numbers exercise. Such an extension suggests that there can be a chambering-and-bullet combination that produces a sufficiently large wound cavity volume that simply overwhelms the animal to the extent that it drops to the shot.
As examples, what kind of terminal performance is expected on a groundhog shot with a 50-grain, cup-and-core varmint bullet launched from a 22-250? A coyote shot with a 75- grain cup-and-core bullet launched from a 240 Weatherby? A 140-pound southern white tail shot at 50 yards with a 150-grain cup-and-core bullet launched from a 300 Winchester? In the absence of wound cavity data from gel testing and the trend lines in Graphs 1 & 2, a reasonable conclusion by the average hunter for all three hypothetical scenarios would be that any observed drop-to-the-shot performance can be attributed to impact energy causing “hydrostatic” shock.
Scott Fletcher Hunting Bullet Metrics 2023 Zebra Management Hunt Report 63
The data used to produce Graph 1 and Graph 2 were obtained from one animal species where both lungs and the heart were breached. A logical conclusion could be that each species has its own travel distance vs wound-cavity-volume-relationship graphs based on the vital organs breached. Consequently, at least two separate graphs of travel distance vs wound cavity volume could be applicable for each species, with separate trend lines for a lungs-only breach, and the other for a lung-and-heart breach. Like Graph 1 & Graph 2, these species-and vital organ-specific graphs would depend only on wound cavity volume. As previously discussed in report section 12.15, wound cavity volume only depends on a bullet’s generic design and impact velocity, and is independent of bullet weight and caliber (diameter).
The calculated “better” coefficient of variation, CV, for the data used to generate Graph 1 suggests a theoretical “fun-with-numbers” exercise based on its trend line. As discussed in report section 6.0, a zebra had been taken by the 300 SGK with a front-quartering shot. Animal reaction, shot-entrance-hole location, and field-carcass bleeding indicated both lungs and the heart had been breached. The shot was taken at about 120 yards, indicating that the 300 SGK’s field impact velocity nearly corresponded to its gel-test impact velocity. The paced travel distance after the shot had been estimated at about 35 yards. No skinning shed autopsy was performed, and certainly no determination of TBSTV was made.
The gel testing results shown in Table 2 indicate V(ST) for the 300 SGK is 26.4 cubic inches, and the V(ST) for the 200 WWC is 23.5 cubic inches. The V(ST) of the 300 SGK is thus about 12% greater. If the concept of “qualitative parity” (field impact velocity compatible with gel-test impact velocity, common bullet tumbling, breaching common bones and vital organs, common bullet weight loss, common shot angle, etc.) is valid and the trend line identified by Graph 1 is unique to just a zebras, the question that begs to be asked is: “What would be the hypothetical travel distance of the zebra shot with the 300 SGK, assuming its TBSTV was 12% greater than Z-9’s TBSTV, shot with a 200 WWC at approximately the same distance (119 yds)?”
A 12% increase in Z-9’s TBSTV (450) would result in 504 cubic inches. The trend-line’s equation for Graph 1 is TD = (-.221) x TBSTV + 148. The resulting substitution of numbers would be TD = [(-.221) x 504] + 148 = [-111 + 148] = 37 yards, within two yards of a paced 35 yards. Even more outrageous is the fact that a 30-caliber, 220 SPH produced a travel distance within 4 yards (41) of the .375-caliber, 300 SGK’s paced travel distance. Such a numbers exercise further underscores the assertion that time to death, as indirectly determined by travel distance after the kill shot, is only dependent on wound cavity volume.
12.16 Terminal Performance Implications Suggested by Graph 3
Graph 3 shows the trend line relating impact energy to travel distance for the same five zebras as Graph 1 & Graph 2, determined by the same linear regression calculation steps. The trend line for Graph 3, however, indicates that travel distances increase with increasing impact energy. This outcome is neither logical nor reasonable.
Scott Fletcher Hunting Bullet Metrics 2023 Zebra Management Hunt Report 64
There could be at least two potential explanations for the “backwards” trend line on Graph 3. The first explanation is that five impact energy data points that include bullets of different generic designs and weights aren’t nearly sufficient to identify a “true” travel-distance trend line that has a relatively similar slope to Graph 1 & Graph 2.
The implication of this first explanation is that there could be a significantly large number of data points to establish a logical relationship between impact energy and travel distance. If such a logical relationship exists, the implication is there would be greater data scatter that would likely produce a correlation coefficient significantly less than -.92 for Graph 1 and -.93 for Graph 2. Consequently, any correct, reality-based graph of travel distance, TD, vs impact energy, IE, can likely be expected to produce a significantly less precise prediction of the intended travel-distance relationship.
The second explanation is that impact energy only predicts the volume of the wound cavity formed, with a higher impact energy presumably producing a higher wound cavity volume. The implication is that there is no relevant relationship between travel distance and wound cavity volume.
Graph 4 shows the trend line relating total bloodshot tissue volume, TBSTV, to impact energy, IE, for the five referenced zebras. Graph 5 shows the trend line relating total bullet hole volume, TBHV, to impact energy IE for the five referenced zebras. Both graphs were determined using linear regression analysis previously discussed. As with Graph 3, the trend lines in both Graph 4 and Graph 5 are illogical, indicating that cavity volume decreases with increasing impact energy. If impact energy is a true indicator wound cavity volume magnitude, the cavity volumes would increase with increasing impact energy.
The bottom-line implication of Graph 3 is that using bullet impact energy as a metric to predict terminal performance in terms of either travel distance or wound cavity volumes is problematic, at best, to totally inapplicable. Regardless, using impact energy to predict travel distance after KS bullet impact is obviously inferior to using wound cavity volume, however determined.
12.17 The Effect of Kill-Shot Bullet Impact Velocity on Wound Cavity Volume
The engineering mechanics used to explain how the conceptual wound cavity is formed is based on the bullet’s deformation characteristics and its impact velocity (eBook Chapter 10). Mann’s data (eBook Chapter 10) support that assertion: gel-test data show that for one selected expanding hunting bullet, the cavity volume increased with increasing impact velocity.
For all bullets used on this hunt, greater impact velocities should produce greater bullet deformations, resulting in greater wound cavity volumes. If this relationship is true, then graphs of both total bloodshot tissue volume (TBSTV) versus impact velocity (IV) and
Scott Fletcher Hunting Bullet Metrics 2023 Zebra Management Hunt Report 65
total bullet-hole volume (TBHV) versus impact velocity (IV) for a specific bullet should have trend lines that show cavity volumes increasing with increasing impact velocities.
Graph 6 is a linear regression plot that shows total bloodshot tissue volume (TBSTV) versus impact velocity (IV) for the three-zebra shot with the 200 WWC. (Z-7, Z-8, & Z-9). The calculated equation for the trend line shown on Graph 6 is TBSTV = (3.353) x (IV) -8476. The computed correlation coefficient of the trend line is 0.79, indicating a fair-to-good correlation between TBSTV and IV. Although the sample population of three animals is small, the trend line shown in Graph 6 indicates a logical correlation between TBSTV and IV, with an increase in IV resulting in an increase in TBSTV.
Graph 7 is a linear regression plot that shows the total bullet-hole volume (TBHV) versus impact velocity (IV) for these same zebras. The calculated equation for the trend line shown on Graph 7 is TBHV = (1.302) x (IV) -3368. The computed correlation coefficient of the trend line is 0.91, indicating a very good correlation between TBHV and IV. As with Graph 6, the trend line in Graph 7 indicates a logical correlation between TBHV and IV, with an increase in IV resulting in an increase in TBHV.
Both Graph 6 and Graph 7 logically indicate that increasing impact velocity for a specific bullet results in increased wound cavity volume, however determined.
12.18 Gel Test Implications Suggested by Table 2, Table 4, Graph 1, and Graph 2
Table 2 indicates the 240 TSMK’s gel-test value of V(ST) is about 13% less than the V(ST) gel test value of the 200 WWC, and the 220 SPH’s gel-test value of V(ST) is about 18% less. These reduced values give the expectation that the skinning-shed values of both TBSTV and TBHV should be less than a 200 WWC’s for these two bullets, with the travel distances correspondingly more. Yet Zebra Z-3, shot with a 240 TSMK, and Zebra Z-5, shot with a 220 SPH, both produced skinning-shed wound cavity volumes, however determined, that were comparable to the wound cavity volumes produced by the 200 WWC used to take Zebra Z-9. Furthermore, the travel distances of both Z-3 and Z-5 were comparable to less than Z-9’s. Such a disparity in field wounding and travel distance to that expected from gel-test modeling indicates that the radial extent of the bullet shards in the gel should have been included in determining gel test V(ST)’s.
Including the radial extent of the bullet shards in determining the gel test V(ST) is underscored by its fundamental relationship to I(V). The greater radial extent of the bullet shards would ultimately result in an increased calculated value of I(V). Consequently, bullets prone to lose weight during testing, such as the 240 TSMK and the 220 SPH, would have higher numerical I(V) values than those identified in Table 2. These higher I(V) values would give a better expectation of the relatively large bloodshot-meat volume produced by these two bullets, as verified by the skinning-shed autopsies. The disparity in bloodshot meat to that expected from gel-test modeling also indicates that the radial extent of the bullet shards in the gel should have been included in determining gel test V(ST)’s.
Scott Fletcher Hunting Bullet Metrics 2023 Zebra Management Hunt Report 66
12.19 Terminal Performance Implications Suggested by All Graphs
If the basic assumption that a uniformly sprinted travel distance after the kill shot is an indirect measure of the time to death, then both Graph 1 and Graph 2 support Dr. Fackler’s conclusion that the magnitude of wound cavity volume, however measured, is directly related to the time to death, with a progressive increase in wound cavity volume resulting in a progressive decrease in time to death. Consequently, wound cavity volume, however measured, is a fundamental, relevant terminal performance metric. Furthermore, Graph 1 and Graph 2 indicate the wound cavity volume is controlled by an individual bullet’s generic design and impact velocity, as substantiated by Graph 6 and Graph 7. Graph 3 indicates a bullet’s impact energy is likely not a direct indicator of any aspect of terminal performance, as substantiated by Graph 4 and Graph 5.
12.20 Hydrodynamic Shock Implications Related to Bullet Impact Energy
There were insufficient data to produce any relationship between kill-shot bullet impact energy and a drop-to-the-shot reaction attributable to hydrodynamic shock. As previously discussed, the only drop-to-the-shot reaction of an animal was produced by a bullet with the 9th highest (next to last) impact energy of all the KS bullets. Consequently, there are no field data to substantiate the premise that increasing a specific bullet’s impact energy increases the likelihood of a drop-to-the-shot reaction. Furthermore, the occurrence of blood hammer, interpreted to be a direct indicator of hydrodynamic shock, was clearly indicated by skinning-shed autopsies to be independent of impact energy.
12.21 The Relevance of Using Bullet Expansion Ratio, ER, to Both Predict and Evaluate Field Wounding
The interpreted intent of media-testing expanding hunting bullets is to evaluate their wounding potential. Wounding has both a length and a diameter component that results in a wound volume. The inferred, simplistic basis for judging the “length” component is penetration, L(T), and the inferred, simplistic basis for judging the “diameter” component is expansion ratio, ER. The implied assumption is that the resulting wound is a uniform cylinder, and that the mushroom diameter of the bullet retained in the media is representative of its diameter throughout its entire penetration length.
ER only reflects the bullet’s diameter at the end of its penetration journey through either the test media or the animal. As discussed in report section 12.5, a bullet’s’ gel-test ER is not representative of its field ER due to bone penetration through an animal. Moreover, some bullets are prone to exhibit variable/erratic mushroom formation from penetration through testing media. The extent of such variability is dependent on a bullet’s generic design and the test impact velocity. Consequently, the mushroom diameter of the retained bullet may not represent an assumed uniform diameter or its maximum diameter throughout its penetration length.
Scott Fletcher Hunting Bullet Metrics 2023 Zebra Management Hunt Report 67
As discussed in report section 8.3.3, the cup-and-core, 220 SPH could not maintain its initial mushroom diameter during passage through the 20% synthetic gel. Based on Photo P-13, the initial mushroom was apparently stripped away because its end area could not withstand the imposed drag force. Cavity diameter measurements tabulated in 8.3.3 substantiate this mushroom diameter decrease. These measurements also indicate that the drag forces imposed by the gel apparently re-formed the mushroom. However, interpretation of Photo P-13 indicates the bullet continued to spall shrapnel-sized shards after this mushroom re-formation. These mushroom-spalling, mushroom-re-forming cycles indicate the retained-bullet’s mushroom diameter, with its attendant ER, is likely not the same at various test-penetration lengths. Consequently, this “final” mushroom diameter may not represent its maximum diameter and likely misrepresents any simplistic inference of cavity volume.
Such misrepresentations are characterized in Table 2. As discussed in report section 8.3.3, the Guppy metric V(ST) was used to evaluate the degree of wound volume potentially produced by each bullet. The ER for the 220 SPH is about 5% less than the ER for the 180 SAF. This decreased ER implies that the 220 SPH should produce at least 5% less V(ST) wound cavity volume than the 180 SAF. Yet, the under-predicted V(ST) wound cavity volume of the 220 SPH, as determined from the 20% synthetic gel testing, is about 10 % more, likely considerably greater if its volume calculation had included the radial extent of the shrapnel shards.
eBook Chapter 7 presents a discussion of how the general Guppy shape can indicate the general terminal performance characteristics of a particular bullet. eBook Chapter 14 presents a discussion of how the Guppy shape and the test metrics defined in Guppy Tech can be used to evaluate how design modifications to a bullet can change test metric values. These discussions describe how the Guppy model and attendant metrics can be used to conceptually evaluate both terminal performance strengths and potential limitations of a tested bullet.
For example, the 240 TSMK has an ER essentially the same as the ER of the 200 WWC (Table 2). The 240 TSMK’s V(ST) value is only about 13% less than the V(ST) of the 200 WWC (Table 2). As discussed in report section 8.3.3, the V(ST) of the 240 TSMK is likely under-predicted. Both the test ER values and under-prediction of the 200 WWC’s V(ST) imply that the 240 TSMK’s V(ST) is essentially comparable to the 200 WWC. However, the 240 TSMK’s Dmax is about 4% greater than the Dmax of the 200 WWC, and its L(S) is about 30 % less. These test values indicate that the wounding violence of the 240 TSMK would be concentrated in a much smaller zone of an animal’s thoracic cavity. Such a data assessment indicates that the 240 TSMK should realistically be used only for broadside shots, as the implied wounding potential could dissipate at a far greater rate than that of the 200 WWC.
The 220 SPH gel test results and the previous 240 TSMK example demonstrate that testing in 20% synthetic gel and evaluating the results with the Guppy model and its attendant metrics are far more relevant and applicable for assessing wounding than any simplistic evaluation using ER.
In addition to affecting bullet weight-retained (WR) values, penetration through bone can significantly affect retained-bullet ER values. The 200 WWC, retained in Zebra Z-1
Scott Fletcher Hunting Bullet Metrics 2023 Zebra Management Hunt Report 68
(Table 5), had its lead core sheared away. Its resultant ER is 1.29 (Photo P-34, 3rd bullet from the left). This ER is about 41% less than the ER of the test bullet (2nd bullet from the left). The 220 SPH, retained in Zebra Z-2 (Table 7) apparently “pancaked” from impacting a far-side rib, and was significantly off-set from its centerline axis. Its resultant ER is 2.29 (Photo P-36, 3rd bullet from the left). This ER is about 25% more than the ER of the test bullet (2nd from the left).
Field data clearly show that wounding in an animal’s thoracic cavity is not uniform as implied by a simplistic application of ER. As discussed in report section 12.9, data in Table 8 show that wounding between the near-side and far-side lungs can either decrease or increase. An increase in wounding is interpreted to depend on the degree of bullet tumbling and weight-loss-producing shrapnel that results from penetration through bone. As with the bullets retained in the 20% synthetic gel, ER values of field-retained bullets reflect the penetration journey required to reach the far-side hide. Like field WR values, the relevance of field ER values should be judged within the context of the penetration length achieved and the type and number of bones breached.
12.22 The Potential for Blood Hammer to Degrade Edible Meat Quality
As discussed in report section 11.18, both the degree and extent of blood hammer appears to be dependent on the severity of hydrodynamic shock. The skinning-shed autopsies indicated that as the interpreted severity of hydrodynamic shock increased, there was a resulting progression of blood hammer from the neck toward the rear haunches and down the shoulders. The migration of blood hammer toward the haunches was concentrated along the spine in tissue commonly called “back strap” by hunters. Back strap is typically considered by hunters as the “best” edible meat on the animal.
Photo P-50 shows the extent and the severity of blood hammer on Zebra Z-6, the only animal interpreted to have expired from hydrodynamic shock. The severity of blood hammer on Zebra Z-2 was visually judged to be more severe. The back strap was not removed from either animal to assess the relative degree of meat degradation caused by blood hammer. This degradation is likely significantly less than actual bloodshot meat produced directly by passage of a bullet, as shown in Photo P-40. However, the bleeding identified in Photo P-50 indicates that some degradation in edible-meat quality has likely occurred due to shock-induced blood hammer, regardless of where the bullet penetrated through the animal.
Scott Fletcher Hunting Bullet Metrics 2023 Zebra Management Hunt Report 69
13.0 Summary Conclusions
The format for the following summary conclusions is based on sequentially addressing the ten management hunt objectives presented in report section 5.0. These conclusions provide summary overview to conclusions on specific technical aspects of the data that were presented in report section 12.0. Refer to report section 12.0 for detailed discussions and conclusions associated with the identified technical topics.
13.1 Did Guppy metrics obtained from testing hunting bullets in 20% synthetic gel reasonably predict field terminal performance and skinning-shed observations of thin-skinned African plains game?
When Guppy metric values were rigorously applied to predict field values determined by direct measurements, No.
When Guppy metric values of V(ST), L(T) and I(V), determined from testing in 20% synthetic gel, were used as relative, comparative indicators to empirically predict field terminal performance outcomes, Yes.
Passage of an expanding hunting bullet through an animal to reach vital organs introduces numerous and interactive variables that affect terminal-performance-related field outcomes. These variables include both singular and compound bullet passage through bones (shoulder joint, scapula, rib, etc.), different numbers of bones (e.g. one or multiple ribs) and tissue of varying density (e.g. muscle vs lung). Furthermore, hunt data indicate that varying degrees of bullet mushrooming, tumbling, and shrapnel release also affect terminal performance-related field outcomes.
Because of such variables, using any analytical model with any testing medium to predict field outcomes that can be rigorously confirmed with direct measurements is realistically impossible. Consequently, the predictive capability of any terminal performance model can only be considered empirical, and the test medium can be considered a matter of convenience.
The Guppy analytical model identified in this report is personally derived (eBook Chapter 12). It represents the wound-cavity volumes of both bloodshot tissue and the bullet hole. Bloodshot tissue is considered to be debilitated tissue, and fundamentally conforms to what a hunter calls “wounding”. These wounding limits are modeled by cracks that form in 20% synthetic gel from passage of an expanding hunting bullet. The Guppy-model shape formed by the radial limits and longitudinal extent of these cracks is a generalized schematic representation based on published research done by a military physician, Colonel Martin Fackler.
The model schematically identifies test metrics, with associated lengths, diameters, and volumes, that attempt to simulate and quantify the extent and magnitude of modeled wounding. These metrics are mathematically defined in Guppy Tech. The model is simplistic because it does not contain an embedded bone, a specific number of bones, nor
Scott Fletcher Hunting Bullet Metrics 2023 Zebra Management Hunt Report 70
a spacing of bones conforming to an identified standard that must be breached by the bullet.
20% synthetic gel was selected as a testing expedient to replace FBI ordinance gel (eBook Chapter 12). This synthetic gel is known to be unrepresentative of human (animal) tissue. Consequently, no test metric values were rigorously verified by direct measurements of wounding obtained in skinning-shed autopsies, nor were they expected to be.
Guppy metric V(ST) is intended to model the volume of the actual bullet hole as well as the bloodshot tissue that surrounds it. Based on Dr. Fackler’s research conclusion that the volume of the wound is directly related to the time to death, the magnitude of V(ST) was selected as an empirical indicator of a big-game animal’s maximum travel distance after the kill shot. The V(ST) test data of 30-caliber bullets of varying generic designs and weights were compared to the V(ST) data of a .375-caliber, 300-grain Sierra Game King (SGK) used as the field performance standard. The objective was to identify, through field measurements, if the maximum travel distance of animals shot with any of the 30-caliber bullets was similar to the demonstrated maximum travel distance that had been obtained by the 300 SGK, strictly based on V(ST) test result comparisons.
Three, 30-caliber bullets with V(ST) test results that were reasonably comparable to the 300 SGK’s were selected for evaluation on this management hunt. The bullets selected and the rationale for their selection are presented in section 9.0 of this report. Bullet nomenclature is identified in Table 1, and gel test results are identified in Table 2. Personally conducted testing in 20% synthetic gel has indicated gel test results of selected 30-, 35-, and .375-caliber expanding hunting bullets depend only on a specified bullet’s generic design and resulting test impact velocity, and are independent of bullet weight and diameter (caliber).
The 300 SGK’s demonstrated, field-performance standard was a maximum travel distance of 90 yards after a bullet had breached both lungs and the heart or the plumbing directly above the heart. The stipulated maximum travel distance performance standard for the 30-caliber bullets was 100 yards after breaching these same vital organs. The rational for this 10-yard increase is discussed in section 8.3.3 of this report.
Zebras Z-7, Z-8, Z-9, Z-3, and Z-5 had both lungs and the heart or plumbing above the heart breached by each of the 30-caliber bullets (Table 4). All kill-shot bullet impact velocities for these five zebras were within plus or minus 100 feet per second of the bullets’ test impact velocities. Consequently, the gel-test results for V(ST) were judged to be applicable for empirically assessing the resultant travel distances.
Scott Fletcher Hunting Bullet Metrics 2023 Zebra Management Hunt Report 71
All animals sprinted after the kill shot in an attempt to flee at a speed judged to be comparably the same. The common sprint speed mathematically allows travel distance to be directly related to time to death. Hunt data used to create Graph 1 demonstrate that there is a linear relationship between travel distance (TD) and bloodshot tissue wound cavity volume (TBSTV), determined in skinning-shed autopsies. This linear relationship has a correlation coefficient 0f - 0.92, considered as very good to excellent. This demonstrated linear relationship between actual wounding and travel distance after the kill shot fundamentally allows an empirical correlation between the gel test results of V(ST) to field travel distances.
Travel distances for these five zebras were less than the comparative performance standard of 100 yards, ranging from 41 to 94 yards. This result indicates if field impact velocities are reasonably comparable to test impact velocities for both the bullets being evaluated and the comparative standard, V(ST) test values of candidate bullets can be a reasonable empirical predictor of big-game maximum travel distance after the kill shot when compared to the V(ST) test results of a bullet with a demonstrated field maximum travel distance.
Guppy metric L(S) identifies the test limits of V(ST). Personal gel testing of eleven bullets that included four of the interpreted five generic designs has indicated that V(ST) typically contains over 90% of the modeled wound cavity volume. This wound volume can qualitatively be described as a “significant majority”.
Skinning-shed autopsies indicated primary wounding occurred in the thoracic cavities of the animals observed and typically decreased in wound area between the near-side and far-side lungs. This decrease in wounding is generally indicated by the “Guppy” schematic shape. However, data in Table 8 do not support a quantitative degree of wounding associated with a magnitude on the order of 90%, nor can the wounding be reasonably, qualitatively described as a “significant majority”.
The likely, primary reason for the disparity between the model and the skinning-shed wounding data is that no bones were embedded in the test gel. Therefore, the schematic “Guppy” shape does not model the limits and extent of the wounding that can occur in the field due to a bullet breaching bone. Consequently, the field data indicate the limits of a modeled L(S) within the thoracic cavity of a big-game animal could not be reasonably identified by direct or indirect observations/measurements obtained from skinning-shed autopsies.
Guppy metric L(T) is intended to model total penetration of a bullet within a big-game animal. The L(T) test value of the 300 SGK standard was compared to the L(T) test value of the selected 30-caliber bullets. The intent of this comparison was to qualitatively assess if the test penetrations of the 30-caliber bullet candidates would be “enough” to have them at least be retained by the far-side hide after passing through the thoracic cavity, as their test penetration lengths were from about 4% to 21% less than the test penetration length of the 300 SGK. As described in section 8.3.4 of this report, the 300 SGK had always breached all near-side bones and passed completely through the thoracic cavity on broad-side, front-quartering and rear-quartering shots. It had exited animals more often than not from all shot angles, or had at least been retained by the far-side hide.
Nine, 30-caliber bullets completely breached the thoracic cavity of the big-game animals taken on the management hunt. Five (56%) exited the animals, and four (44%) were retained by the far-side hide. Such field penetration performance indicated that each candidate bullet’s field penetration had been “enough” to meet the stipulated hunt penetration performance criterion, However, the disparities between actual field penetrations and each bullet’s test penetration, as shown in Table 5, Table 6, and Table 7, indicated that there was no apparent direct, quantitative empirical correlation between them. The penetration variables associated with bone breaching and bullet tumbling, identified in the tables, indicate that such a quantitative empirical relationship would be highly unlikely.
Scott Fletcher Hunting Bullet Metrics 2023 Zebra Management Hunt Report 72
Although there was no quantitative empirical relationship between test values of L(T) and field penetration lengths, the hunt data suggested a reasonable qualitative empirical relationship. If field impact velocities are compatible with each bullet’s generic design and reasonably compatible with the test impact velocity, the composite penetration data from Table 5, Table 6, and Table 7 indicate that field penetrations through the thoracic cavity of a big-game animal are comparable (within about 10%) to greater than test penetrations, L(T) obtained from testing in 20% synthetic gel. This empirically predicted performance indirectly implies that the physical properties of 20% synthetic gel reasonably simulate/model typical bone breaching and random bullet tumbling that customarily occur in response to an expanding hunting bullet passing through a big-game animal’s thoracic cavity.
Guppy metric I(V) is intended to be a qualitative, empirical predictor of potentially edible tissue that is destroyed by the passage of an expanding hunting bullet through a big game animal’s shoulder(s). Such destroyed tissue is called bloodshot meat (BSM) by hunters, and its volume is subjectively judged as either acceptable or unacceptable. As discussed in section 8.3.5 of this report, the I(V) test value of a 30-caliber, 165-grain Barnes TSX (BTSX) was used as the comparative standard rather than the 300 SGK, based on its generic design’s established field reputation for producing low volumes of BSM.
Each bullet selected for the management hunt had an I(V) test value from about 180% to 270% greater than the comparative standard. Strictly based on the disparity of the test values, there was no expectation that any of the selected bullets would produce an acceptable, qualitative volume of BSM, as determined by an experienced and knowledgeable Professional Hunter (PH) during skinning-shed autopsies. However, there were no quantifiable field BSM data that served as an I(V) calibration to indicate if an acceptable volume of BSM was potentially possible from any candidate bullet.
As identified in Table 4, only the 200 Woodleigh Weldcore (WWC) produced a volume of BSM judged to be acceptable by the PH. This bullet had an I(V) test value of 10.2. This evaluation potentially indicates that if a bullet is tested in 20% synthetic gel at a test impact velocity that is compatible with its generic design and reasonably simulates likely field impact velocities, an I(V) value on the order of 10, as determined by the Guppy model, could potentially produce a satisfactory volume of BSM from shots on the shoulder. Conceptually, bullets with I(V) test values progressively less than 10 could be expected to produce progressively less BSM, and bullets with I(V) test values progressively greater than 10 could be expected to produce progressively more BSM.
Both the test and field data show the application of Guppy metrics V(ST), L(T), and I(V) for comparative or empirical prediction of field terminal performance is fundamentally dependent on the test impact velocities in 20% synthetic gel being compatible with each bullet’s generic design and representative of actual field impact velocities.
Scott Fletcher Hunting Bullet Metrics 2023 Zebra Management Hunt Report 73
13.2 Was there an identifiable and logical relationship between wound cavity volumes determined from skinning-shed autopsies and travel distance after the kill shot?
Yes.
As identified in Table 4, Zebras Z-7, Z-8, Z-9, Z-3, and Z-5 all had both lungs and the heart or plumbing above the heart breached by kill-shot bullets. These animals were selected to assess if there was any identifiable relationship between wound cavity volumes determined from skinning-shed autopsies and travel distance after the kill shot. As discussed in section 12.1 of this report, the field impact velocities of each kill-shot bullet for these zebras were judged to be representative/compatible with the gel-test impact velocities identified in Table 4.
Graph 1 is a linear regression plot of total bloodshot tissue volume, TBSTV, vs travel distance, TD. The Guppy model is based on the assumption that the metric V(ST) represents TBSTV. Graph 2 is a linear regression plot of total bullet-hole volume, TBHV, vs TD. TBHV is the interpreted basis of Dr. Fackler’s research conclusions.
The trend line of both graphs logically indicates that travel distance decreases as cavity volume increases. The correlation coefficient of both graphs is in the -0.9’s, indicating at least a very good correlation of the data used in the graphs. All zebras were judged to have uniformly sprinted the travel distance after the kill shot, indicating that travel distance is a reasonable approximate indicator of time to death. Consequently, both graphs are judged to corroborate Dr. Fackler’s research conclusion that a larger wound cavity volume produces a shorter time to death.
The wound cavity data used for both graphs were obtained from three different 30-caliber bullets with three different weights and two different generic designs. The trend lines of Graph 1 and Graph 2 both underscore that wound cavity volume, however determined, depends only on a specified bullet’s generic design and impact velocity, and is independent of its weight and caliber (diameter).
13.3 Was there an identifiable and logical relationship between bullet impact velocity and wound cavity volumes determined from skinning-shed autopsies?
Yes.
Data discussed in eBook Chapter 10 indicate that as long as the impact velocity is within a “sweet-spot” range compatible with each bullet’s generic design, wound cavity volumes typically increase with increasing impact velocity. As discussed in section 9.0 of this report, the kill-shot impact velocities for all bullets were judged to be in a range compatible with their generic designs.
Scott Fletcher Hunting Bullet Metrics 2023 Zebra Management Hunt Report 74
Zebras Z-7, Z-8, and Z-9 were all shot with a 200 WWC. As indicated by Table 4, the wound cavities were through common organs. Graph 6 is a linear regression plot that shows total bloodshot tissue volume (TBSTV) versus impact velocity (IV) for these three zebras. Graph 7 is a linear regression plot that shows the total bullet-hole volume (TBHV) versus impact velocity (IV) for these three zebras. The trend lines for both graphs logically indicate wound cavity volume, however determined, increases with increasing impact velocity.
13.4 Was there any apparent and reasonable relationship between a bullet’s impact energy and travel distance after the kill shot, wound cavity volumes determined in the skinning shed, and what hunters typically call hydrostatic shock?
No.
Accepted doctrine is the magnitude of a bullet’s impact energy fundamentally controls its terminal performance. Consequently, any travel distance after the kill shot through a big-game animal’s thoracic cavity should decrease with increasing impact energy; wound cavity volume, however determined, should increase with increasing impact energy; and the occurrence of what hunters call “hydrostatic” shock should occur at comparatively high numerical values of impact energy.
Graph 3 is a linear regression plot of impact energy (IE) vs travel distance (TD) after the kill shot for the same five zebras identified for Graph 1 and Graph 2. The trend line of this graph indicates that the travel distance increases with increasing impact energy. This relationship is totally illogical and opposite of what should be expected. The trend line of Graph 3 indicates there is no reasonable relationship between a bullet’s impact energy and travel distance after the kill shot.
Graph 4 is a linear regression plot of total bloodshot tissue volume (TBSTV) vs impact energy (IE) for the same five zebras identified for Graph 1. Graph 5 is a linear regression plot of total bullet-hole volume, (TBHV), vs IE for the same five zebras as identified for Graph 2. The trend lines for both graphs indicate that wound cavity volume, however determined, decreases with increasing impact energy. These relationships are totally illogical and opposite of what should be expected. The trendlines of both Graph 4 and Graph 5 indicate there is no reasonable relationship between a bullet’s impact energy and wound cavity volume, however determined.
Only Zebra Z-6 was assessed to have expired from hydrodynamic (“hydrostatic”) shock. The impact energy that produced the drop-to-the-shot response was the 9th highest (next to last) of all bullet impact velocities identified in Table 4. Consequently, there is no apparent and reasonable relationship between a kill-shot bullet’s impact energy and “hydrostatic” shock.
Scott Fletcher Hunting Bullet Metrics 2023 Zebra Management Hunt Report 75
Hunt data and skinning-shed observations of animal carcasses lead to a personal, speculative definition of “shock”. Report section 11.18 presents an alternative definition of shock believed to be consistent with animal physiology and those observations. Based on that definition, hunt data, and skinning-shed observations, a speculative conclusion is presented on the expected frequency of actual “shock” producing a drop-to-the-shot reaction.
Analysis of hunt wounding data suggests an alternative, conceptually feasible explanation for the drop-to-the-shot reaction typically associated with “hydrostatic” shock. This explanation, with attendant conclusions, is presented in report section 12.15.
13.5 Did a bullet’s field weight loss adversely affect its penetration through vital organs?
No.
Data in Table 5, Table 6, and Table 7 indicate weight loss of recovered bullets ranged from 20 to 60% (corresponding weight retained ranged from 80 to 40%). In one instance, a cup-and-core bullet shed its jacket, with the jacket being retained in the animal and the core completely breaching the carcass (Table 6; black wildebeest). Various bullets breached multiple bones, including the shoulder scapula (?), one-to- three near-side ribs, the spine, neck vertebrae, and typically one far-side rib. No bullets shot during the management hunt were stopped by any bone. Six completely breached the animal, and four were retained by the far-side hide.
The generic designs of the bullets used on this management hunt have no premeditated design provisions for limiting bullet weight loss (eBook Chapter 13 and Chapter 15). As indicated in section 9.0 of this report, there was a deliberate hunt strategy to limit both upper- and lower-bound impact velocities based on data from the gel tests, published manufacturer recommendations, and published accounts from practitioners. The intent for limiting the upper-bound impact velocities for each bullet was to reduce the impact stress that could potentially cause undesirable bullet performance, including poor penetration. Based on bullet performance observed on this management hunt, limiting impact velocities to those identified in the referenced report section 9.0 resulted in bullet weight loss compatible with each bullet’s generic design. Consequently, there was no detrimental penetration outcome associated with a bullet’s field weight loss that prevented it from either totally breaching a big-game animal’s thoracic cavity or completely severing neck vertebrae.
Scott Fletcher Hunting Bullet Metrics 2023 Zebra Management Hunt Report 76
13.6 Were bullet penetration lengths, weight retentions, and expansion ratios determined from testing in 20% synthetic gel representative of actual field values?
In the case of penetration lengths, Yes. In the case of weight retentions and expansion ratios, No, more likely than not.
As discussed in section 12.4 of this report, data in Table 5, Table 6, and Table 7 indicate field penetrations through an animal’s thoracic cavity can be characterized as comparable to greater than test penetrations obtained from testing in 20% synthetic gel when test impact velocities are representative of likely field impact velocities and field impact velocities are compatible with each bullet’s generic design. Under those velocity constraints, the test penetration L(T), obtained in 20% synthetic gel, apparently reasonably accounts for the effects of bullet tumbling and some reasonable degree of bone breaching.
As discussed in section 12.5 of this report, only the 220 Sierra Pro Hunter (SPH) had field weight retained (WR) and bullet expansion ratio (ER) values comparable to gel-test values (Table 7). The 200 WWC had field WR values that were less than half of those obtained from gel testing, with field ER values less to significantly less (Table 5). The 240 Tipped Sierra Match King (TSMK) had a field separation of its jacket from its core, a circumstance not indicted by gel testing (Table 6).
The generic designs of the bullets used on this management hunt have no premeditated design provisions to limit both bullet expansion and weight loss. (eBook Chapter 13 and Chapter 15). Even though the bullets used had field impact velocities that were representative of test impact velocities, field penetration through various combinations of bone not modeled by the testing typically produced expected and highly variable field values of WR and ER. Such field variability of WR and ER for both the 200 WWC and 240 TSMK can reasonably be considered normal, with field WR and ER data from the 220 SPH considered as uncharacteristic, coincidental outliers.
The results tabulated in the referenced tables indicate both WR and ER data obtained from either media testing or from recovered animals can be considered, at best, metrics of interest rather than metrics of relevance. Media-tested bullets do not reflect the potential field variability of both WR and ER when they are subjected to field penetration through bone, nor do they indicate the field wound cavity volume, however determined, achieved after successfully passing the animal’s penetration test. Field data contained in this report indicate that the test metric V(ST), as obtained in 20% synthetic gel, can be considered a reasonable and relevant substitute for media-tested values of WR and ER to assess a bullet’s wounding potential.
The hunt data apparently indicate a hidden benefit of using the empiricism presented in eBook Chapter 4, explained in eBook Chapter 19, and applied in section 8.3.2 of this report. Use of the empiricism appears to result in a bullet weight where
Scott Fletcher Hunting Bullet Metrics 2023 Zebra Management Hunt Report 77
sufficient sacrificial mass is available to maintain relic bullet momentum through the animal, resulting in “enough” penetration to at least have the bullet’s remnants retained by the far-side hide. This implied safety factor is particularly important because the hunt data indicate that testing bullets in 20% gel without breaching bone does not typically result in test values of weight retained that are representative of field values.
13.7 Did shrapnel produced by a bullet’s weight loss result in observable/beneficial wounding and tissue bleeding?
Yes.
The generic design of both the 220 SPH and the 240 TSMK is cup-and-core (eBook Chapter 13). As discussed in section 8.3.3 of this report, both bullets shed weight during testing that produced a macroscopic particle size considered to be shrapnel shards. Passage of shrapnel logically produces additional high-flow tributary pathways for blood to drain to the actual cavity created by the bullet, and thus increases the potential for more rapid bleed out.
Evidence of jacket shrapnel spray beyond the actual bullet hole was observed in the lungs and far-side shoulder tissue of Zebra Z-3, shot with a 240 TSMK. The 240 TSMK’s jacket separating from its core can be considered as shrapnel, and produced the most prolific field bleeding in the black wildebeest of all the animals taken in the hunt. The 220 SPH produced wounds in the lungs and heart of Zebra Z-5 that were described as “shredded” during the skinning-shed autopsy, indicating likely contributary wounding from shrapnel. Zebra Z-5 exhibited the most prolific blood free flow from the bullet entrance hole during skinning of all the animals.
Table 8 presents the difference in wound area between the near-side and the far-side lungs. In four (50%) of the eight animals, there is a significant increase in wound area, however determined, between the NS and FS lung that can likely be attributed to macroscopic shrapnel produced from bullet weight loss. Such observable and beneficial wound-area increase, bleeding, and tissue damage indicate bullet weight loss, in the form of macroscopic, particle-size bullet-jacket and core-shrapnel shards, can be considered beneficial rather than detrimental to overall field terminal performance.
Scott Fletcher Hunting Bullet Metrics 2023 Zebra Management Hunt Report 78
13.8 Does the Guppy model, combined with testing in 20% synthetic gel, need any modifications to better empirically predict field terminal performance based on field observations and data?
Yes.
Wound cavity volumes and bloodshot meat volumes determined from skinning-shed autopsies, as well as travel distances after the kill shot, indicate the test value of V(ST) for both the 240 TSMK and 220 the SPH was underpredicted. Consequently, the radial extent of shrapnel beyond the peripheral cracks formed in the gel from passage of the bullet should have been included in determination of V(ST). In doing so, the value of I(V) for these two bullets would have also increased, better representing the qualitative quantity of bloodshot meat identified for both these bullets in the skinning-shed autopsies.
As discussed in section 8.3.3 of this report, both the production of shrapnel and its extent beyond the gel’s radial cracks’ periphery will likely be variable for cup-and-core bullets. Additional tests will be required for this generic design compared to the number of tests for generic designs that typically do not produce shrapnel during gel testing in order to obtain a representative range of values for both V(ST) and I(V).
13.9 Can the Guppy model, combined with testing in 20% synthetic gel, be used to empirically evaluate any terminal performance objective based on a defined hunting problem using specific bullets from any specified chambering?
Yes.
The desired degree of wounding, meat damage, and bullet penetration are all fundamental in establishing a defined hunt’s terminal performance objective (s). This management hunt has shown that the gel test metric values of V(ST), I(V), and L(T) are reasonable empirical predictors of field wounding, meat damage, and penetration, respectively, when compared to corresponding metric values of a bullet with known field performance that is used as a comparative standard. The validity of these comparisons is contingent upon testing in 20% synthetic gel at impact velocities that are representative of field impact velocities and compatible with a bullet’s generic design. With those constraints, these metrics can be used to evaluate any combination of desired terminal performance identified in a defined hunting problem.
The metrics V(ST), I(V), and L(T) were used prior to this management hunt to identify a bullet that produced terminal performance balanced between essentially stopping an
Scott Fletcher Hunting Bullet Metrics 2023 Zebra Management Hunt Report 79
animal and meat preservation. An example of an alternative, terminal-performance objective could be meat preservation, with an attendant high penetration to enhance the likelihood of a bullet exiting the animal to provide an easily identifiable blood trail. Consequently, bullets with low violence indexes, I(V), and high total penetration lengths, L(T), are desirable when compared to a tested bullet identified as the performance standard.
However, personal testing and conceptual analysis/interpretation of generic bullet designs indicate that bullets capable of producing such a combination of gel-test metric values also typically produce comparatively low V(ST) test values. The implication of a comparatively low V(ST) test value, as indicated by observations and data obtained on this management hunt, is the travel distance after the kill shot will likely be comparatively greater than from bullets that typically produce high test values of V(ST). A hunter must judge if this compromise of likely extended travel distance is in keeping with acceptable parameters of the defined hunting problem. If the risk of a potentially extended travel distance is judged to be unacceptable, a bullet of an alternative generic design that produces an increase in V(ST) may need to be considered. The likely attendant increase of I(V) and reduction of L(T) from alternative bullets must be judged as acceptable based on any increase in V(ST).
Each hunter must evaluate any performance compromises in the terminal performance objective(s) indicated by test data based on personal, subjective appraisal of the risks associated with not achieving the desired outcome. This evaluation of risk reinforces the premise that there is no “best” bullet nor “best” generic design, as each hunter’s tolerance for risk within a defined hunting problem is subjective.
The hunting problem defined in this report identified that only one available chambering, the 300 Winchester, was realistically appropriate based on likely shot distances. Testing was not performed on additional 30-caliber bullets to identify if any alternative bullets, less expensive or otherwise, would produce comparable or superior V(ST), I(V), and L(T) values to the ones chosen.
Had there been a self-imposed, maximum shot distance stipulation of 250 yards, personal 20% synthetic gel test data indicated that an alternative chambering with a 35-caliber bullet was available with values of V(ST), I(V), and L(T) that were comparable to superior to the values of the selected 30-caliber bullets. Furthermore, this chambering/bullet combination results in a hand-loaded cartridge cost that could be at least 25% less than the 300 Winchester cartridges used for the hunt. This is an example of how a search for the “best bang for the buck” can influence both the hunting problem definition and judgements of terminal performance risk.
Scott Fletcher Hunting Bullet Metrics 2023 Zebra Management Hunt Report 80
13.10 How did the selected 30-caliber bullets perform on thin-skinned African plains game?
Mr. Craig Dewing, the PH who observed both the field and skinning-shed bullet performance results, was asked to qualitatively rate the bullets used in four performance categories: application (use as a management bullet, trophy bullet or both), penetration, wound volume production, and meat damage. Table 9 catalogues his judgements. Mr. Dewing further volunteered that “Of all the 300 Winchester bullets I have seen, the 240 TSMK is rated excellent as a trophy bullet. No other bullet is comparable”.
The results presented in Table 9 are judgements from a knowledgeable and experienced professional hunter in Africa with no vested interest associated with their publication. The categories are fundamentally relevant and the words used are definitive: no concepts, techno-speak, or qualifiers.
Mr. Dewing’s opinion of the 240 TSMK’s performance as a trophy bullet illustrates the legitimacy and superiority of using actual autopsy-observed bullet penetration and wounding results as the basis for terminal performance judgements rather than the historically accepted metrics of bullet impact energy, weight retained, and expansion ratio. As indicated by the hunt data and analysis contained in this report, bullet impact energy has no relevance in predicting wounding, travel distance after kill shots through an animal’s thoracic cavity, or a drop-to-the-shot reaction associated with “shock”, however defined. Media-tested bullets do not produce weight retained nor expansion ratio data that are representative of field penetration through bone, and are certainly not indicative of wounding potential.
All Mr. Dewing’s judgements were made without knowledge of individual bullet penetration, WR, and ER data from gel tests, or WR and ER data from field-recovered bullets. The specific judgment about the 240 TSMK was made with the understanding that its jacket had separated from its core when exiting from one animal.
The hunt results identified and discussed throughout this report show that specific Guppy metrics can be used to empirically evaluate potential outcomes of related field performance. Mr. Dewing’s single-word judgments referenced in Table 9 are personally assessed as independent corroboration from a knowledgeable practioner that the test metric L(T) can be used to empirically evaluate the field metric “penetration”; the test metric V(ST) can be used to empirically evaluate the field metric “wound volume”; and the test metric I(V) can be used to empirically evaluate a relative volume of “meat damage” when their values are compared to the same test metric values of a bullet with known field performance.
The words used by Mr. Dewing are also considered to succinctly summarize the field results both conceptually and potentially predicted from the analytical and testing process documented in this report. That process began with using an empirical equation to select bullets of appropriate weight based on the weight of the animals hunted. The equation
Scott Fletcher Hunting Bullet Metrics 2023 Zebra Management Hunt Report 81
empirically relates bullet weight to terminal performance that produced satisfactory, “more-likely-than-not” hunt outcomes identified by knowledgeable hunters in both Africa and North America. The bullets were tested in 20% synthetic gel to obtain test values for metrics identified by the Guppy model. These metrics allowed test results to be reasonably explained based on a bullet’s generic design and engineering mechanics principles. The metric test values of candidate bullets were compared to those of bullets identified as field performance standards to select those likely capable of achieving a specified terminal performance objective identified in the context of a defined hunting problem. With no corroborating, pre-hunt field data from the 30-caliber candidate bullets, this analytical and testing process identified a bullet that met the terminal performance objective specified in the defined hunting problem.
The 200 WWC, fired from a 300 Winchester, proved to be the bullet that met the specified terminal performance objective. It produced wounding consistent with essentially “stopping” an animal without producing an unacceptable volume of bloodshot meat on the shoulders.
Without any corroborating, pre-hunt field data, the 200 WWC’s ability to meet the specified terminal performance objective was conceptually considered “likely” based on comparison of its V(ST) and L(T) test values to the comparative-standard 300 SGK’s test values, and “potentially possible” based on comparison of its I(V) test value to the comparative-standard 165 BTSX’s test value (Table 2). Data in Table 4 show that the maximum travel distances of animals shot through the thoracic cavity with this bullet were less than the stipulated maximum of 100 yards. Data in Table 5 indicate this bullet achieved stipulated penetration performance by either exiting the animals or being retained by the far-side hide for all stipulated shot angles. In doing so, it breached a zebra’s shoulder bone (scapula?), multiple rib bones as well as the spine. It was the only bullet that produced an acceptable volume of bloodshot meat from shots on the shoulder (Table 4). This bullet has demonstrated that it is capable of producing satisfactory field results on either a trophy or management hunt.
Based on both field and skinning-shed autopsy results, this chambering/bullet combination has demonstrably shown that it can reasonably replace a 375 H&H firing a traditional 300-grain, cup-and-core bullet intended for hunting thin-skinned African plains game weighing less than about 700 pounds, but without destroying an unacceptable volume of edible meat. Furthermore, an assembled, hand-loaded cartridge is estimated to cost about a third less than the cost of a hand-loaded 375 H&H cartridge using the 300 SGK and brass from the same manufacturer.
The 240 TSMK proved to be the expected long-range trophy bullet potentially indicated by the gel test data and conceptually indicated by the analysis. Its ability to produce shrapnel was not considered in the original computation of V(ST), and the speculated underprediction of its wounding capability was confirmed by both field and skinning-shed data. When this bullet breached both lungs and the heart, the resultant total blood-shot tissue volume (TBSTV) in Zebra Z-3 was only about 3% less than the TBSTV in Zebra Z-9 (Table4), shot with a 200 WWC, rather than the implied
Scott Fletcher Hunting Bullet Metrics 2023 Zebra Management Hunt Report 82
13% reduction indicated by their V(ST) test values (Table 2). Z-3’s travel distance was 51 yards, virtually identical to Z-9’s travel distance of 52 yards.
Its ability to produce additional wounding from shrapnel shards is also exemplified by Zebra Z-3 where such wounding was observed during the skinning-shed autopsy. The ability of this bullet to produce accentuated bleeding from tributary pathways caused by shrapnel to the actual bullet hole was demonstrated by the volume of blood observed spewing from the black wildebeest while it fled as well as the blood that drained to the ground after it dropped.
The 240 TSMK’s test value of I(V) indicated an unacceptable volume of BSM would likely be produced, even without including the extent of shrapnel in the calculation of V(ST). This unacceptable BSM was observed on the near side, bullet entrance shoulder of Z-3. Both the observed wounding and volume of unacceptable BSM underscore the 240 TSMK’s explosive expansion due to the premeditated “soft” metallurgy of both the jacket and core materials inherent in its generic design.
The 240 TSMK’s comparatively high weight and impact velocity at extended shot distances resulted in superior momentum that produced penetration sufficient to totally sever a zebra’s neck vertebrae, as exemplified by Z-4 (Table 6). This potential for excellent penetration was also exemplified by Z-3, as the bullet breached the near-side shoulder bone (scapula?), two near-side ribs, and one far side rib before exiting the animal at a penetration length at least comparable (likely greater) to its test penetration length, L(T).
Mr. Dewing’s comments about the 240 TSMK’s field performance are gratifying. Innovative analysis and testing, coupled with applied engineering mechanics, had transformed an obsolete match bullet into a hunting bullet that out-performed all conventional hunting bullets in a PH’s 24-year data base of 300 Winchester ammunition, hand loaded or otherwise.
The 240’s stock configuration is currently out of favor as a match bullet due to both its reduced ballistic coefficient (BC) and muzzle velocity inherent with the design. However, its BC was judged to be “more than enough” for a long-range hunting bullet application. Any reduction in muzzle velocity was judged as beneficial because it facilitated achieving the desired “slow” maximum impact velocity of 2400 fps considered consistent with its generic design. Furthermore, a 22-inch barrel had been fitted to the rifle with the premeditated objective of further reducing its muzzle velocity, as well as the muzzle velocities of all the selected bullets so that expected impact velocities were consistent with their generic designs.
The as-manufactured 240 Sierra Match King has both a comparatively short nose with a tangent ogive and a long bearing length relative to contemporary configurations. This configuration was judged as preferred for a hunting bullet application because it is conceptually better able to withstand the repeated mushroom-shedding-and-reforming cycles inherent with its cup-and-core generic design and metallurgically “soft” components. Its considerable weight was essentially considered to be both a momentum and shrapnel reservoir, with shrapnel being judged (and subsequently shown by the management hunt) to demonstrably increase wounding and bleeding. The only design
Scott Fletcher Hunting Bullet Metrics 2023 Zebra Management Hunt Report 83
feature judged as a limitation was its conventional match meplat that would be operationally challenged to consistently open upon impact.
Simply installing a polymer tip to initiate mushroom formation was judged to be sufficient to consistently mobilize its inferred violent expansion. Gel testing substantiated this expansion along with the expected, concentrated wounding. Even without including the radial extent of shrapnel in its V(ST) calculation, the 240 TSMK’s gel-test results demonstrated it was a terminal performance contender. Its cavity’s metric values indicated only broadside shots could be reasonably considered. The only substantiative question posed by the testing was whether its penetration would, in fact, be “enough” for use as a trophy bullet. Mr. Dewing’s succinct “excellent” judgement concerning its demonstrated field penetration is the definitive answer that was required.
The 220 SPH proved to be the stealth trophy bullet that was potentially indicated by both the gel test data and by the analysis. As with the 240 TSMK, its ability to produce shrapnel was not considered in the original V(ST) calculation and attendant I(V) calculation. Consequently, the speculated underprediction of both its wounding capability and its propensity to produce unacceptable volumes of BSM were confirmed by both field and skinning-shed data. When this bullet breached both lungs and the heart, the resultant total blood-shot tissue volume (TBSTV) in Zebra Z-5 was only about 2% less than the TBSTV in Zebra Z-9 (Table4), shot with a 200 WWC, rather than the implied 18% reduction indicated by their V(ST) test values (Table 2). Z-5’s travel distance was 41 yards, about 21% less than Z-9’s travel distance of 52 yards.
The effectiveness of this shrapnel wounding was clearly evident during the skinning-shed autopsies of both Zebras Z-2 and Z-5. The initial incision into Z-2’s thoracic cavity produced the most extensive free blood flow of all the initial thoracic-cavity incisions. The term “shredded” was used to describe the wounds observed in the lungs and the heart of Z-5. Free blood flow observed during skinning from the bullet entrance hole in Z-5 was a steady stream that lasted for about five minutes. Such shrapnel-induced bleeding could potentially explain Z-5’s travel distance of only 41 yards, the least of all the animals taken on the hunt.
Passage of this bullet through an animal’s shoulder, as indicated by Z-5, produced obviously excessive BSM. Based on the limited number of animals taken with cup-and-core bullets, the BSM produced by the 220 SPH in Z-5 was visually judged to be more than the BSM produced in Z-3, shot with a 240 TSMK. This observation, coupled with its I(V) test value that was about 25% less than the 240 TSMK’s (Table 2), underscored the requirement that the radial extent of shrapnel produced in the gel test needed to be included in any V(ST) determination to enable calculation of a representative I(V).
This propensity to cause BSM was also potentially indicated by the 220 SPH’s semi-spitzer/round-nose tip. This tip configuration facilitates a larger initial mushroom upon impact, as indicated by both its low L(Dmax) value of only 4 inches and its comparatively high Dmax approaching 2 inches (Table 2). This tip configuration, coupled with its cup-and-core generic design with no provisions to control expansion and limit Dmax, indicated this bullet would likely exhibit rapid, relatively explosive wound-cavity formation. The extensive blood hammer identified on the carcasses of Zebras Z-2 and Z-
Scott Fletcher Hunting Bullet Metrics 2023 Zebra Management Hunt Report 84
5 as well as the extensive volume of BSM noted on Z-5 are considered testimony to the explosive nature of the wound-cavity formation in each animal.
As judged by Mr. Dewing, the 220 SPH exhibited “excellent” penetration on both front-quartering and rear-quartering shots regardless of its generic design’s tendency to lose weight, as indicated by a retained weight of only 58% in Zebra Z-2 (Table 7). The 220 SPH either was retained by the far-side hide or completely exited the zebras. In doing so, it penetrated two near-side ribs of both Z-2 and Z-5, the spine of Z-2, and one far-side rib of both Z-2 and Z-5. The penetration in Z-2 was within 10% of the gel-test penetration, and the penetration in Z-5 was greater than the gel-test penetration.
The 220 SPH is a venerable cup-and-core bullet with a classic semi-spitzer/round nose. It achieved the shortest travel distance of all evaluated bullets, the most prolific bleeding observed in the skinning shed, and penetration judged as excellent by a knowledgeable and experienced PH. Such field performance is fitting testimony to a classic, Africa “tried-and-true” trophy bullet. That this bullet is the most economical of all bullets catalogued in Table 2 is a fitting exclamation point to its exemplary, short-range field performance.
Scott Fletcher Hunting Bullet Metrics 2023 Zebra Management Hunt Report 85
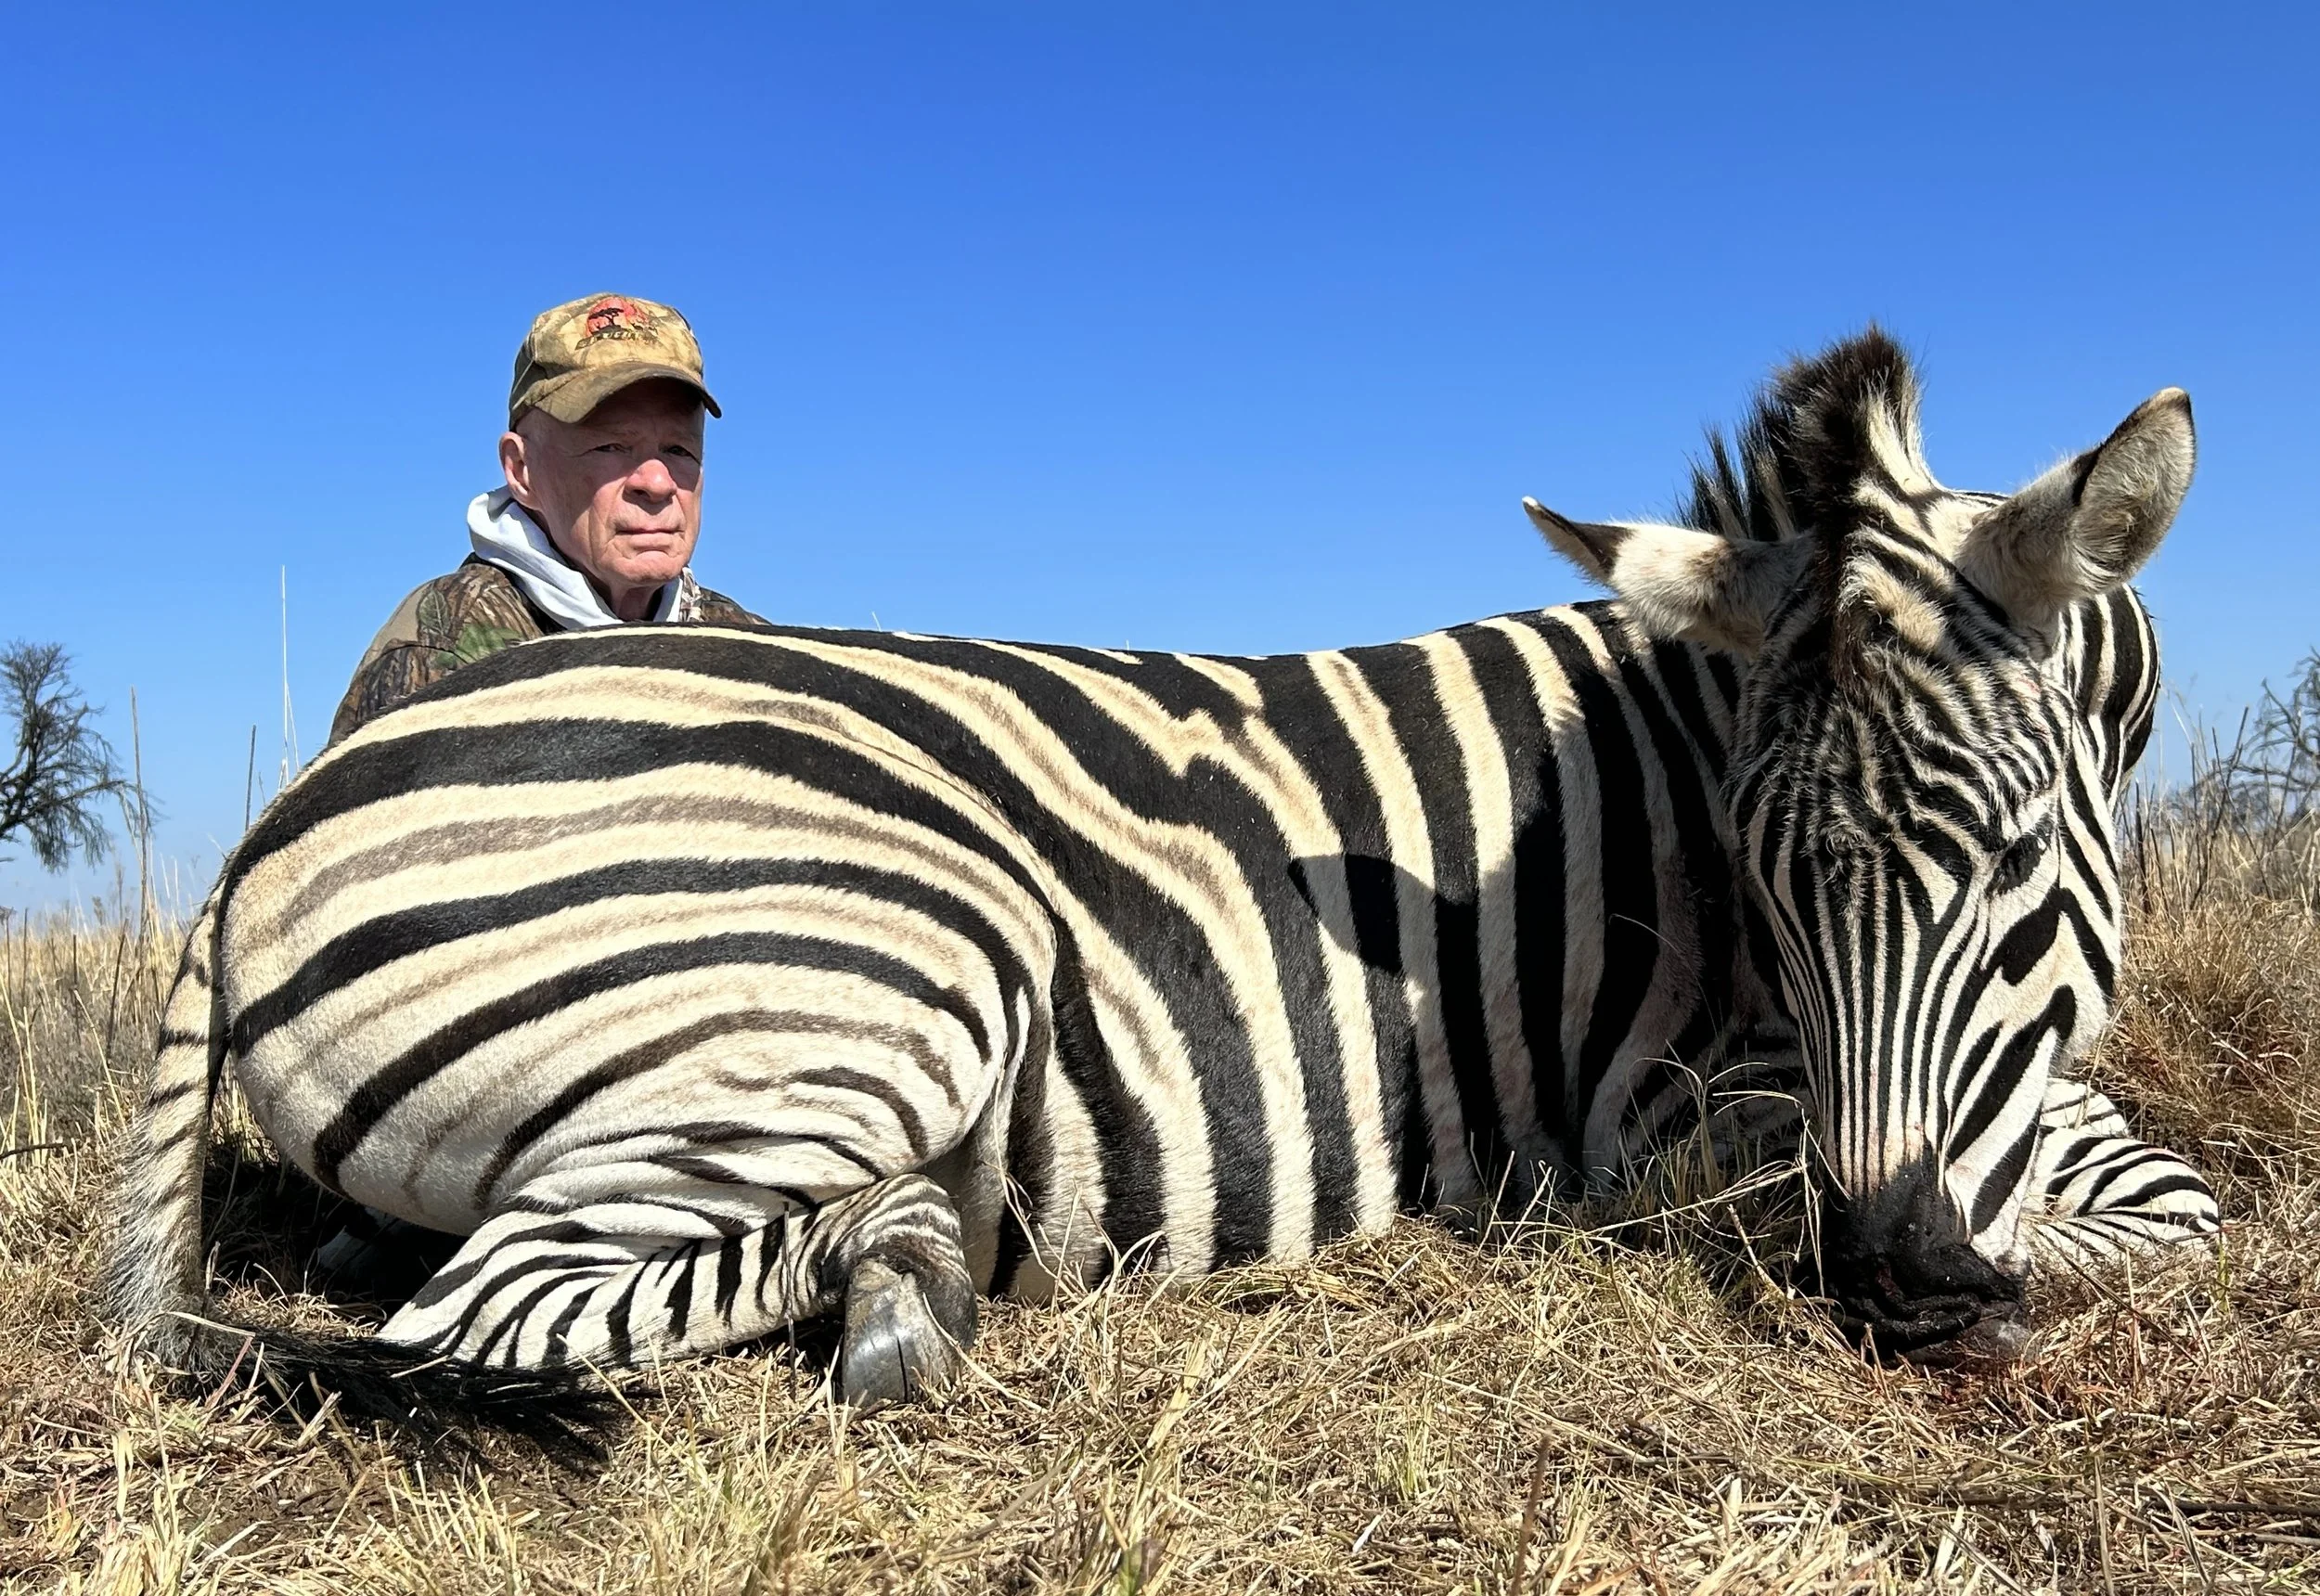